Funding for Agri-food Data Canada is provided in part by the Canada First Research Excellence Fund
Research Data Management
GitHub is more than just a code repository, it is a a powerful tool for collaborative documentation and standards development. GitHub is an important tool for the development of FAIR data. In the context of writing and maintaining documentation, GitHub provides a comprehensive ecosystem that enhances the quality, accessibility, and efficiency of the process. Here’s why GitHub is invaluable for documentation:
- Version Control: Every change to the documentation is tracked, ensuring that edits can be reviewed, reverted, or merged with ease. This enables a clear history of revisions with clear authorship identified to contributors. While this is possible using a tool such as Google Docs or even Word, version control is a central feature of GitHub and it offers much stronger tooling compared to other methods.
- Collaboration: GitHub makes collaboration easy among team members. Contributors can suggest changes, discuss updates, and resolve questions through pull requests and issues.
- Accessibility: Hosting documentation on GitHub makes it easily accessible to a wide audience. Users can view, clone, or download the latest version of documentation from anywhere.
- Markdown Support: GitHub natively supports Markdown which is a simple and powerful way to create and format documentation. Markdown lets you write clean, readable text with minimal effort.
- Integration and Automation: GitHub integrates with various tools and services. One common usage in documentation is the ability to connect GitHub content with static site generators (e.g., Jekyll, Docusaurus). This then allows documentation to be presented as a webpage with a clean interface for reading, but with the backend tools of GitHub for content management and collaborative creation.
Learn how to start using GitHub
To learn more about how to use GitHub, ADC has contributed content to this online book with introductions to research data management and how to use GitHub for people who write documentation. This project itself is an example of documentation hosted in GitHub and using the static site generator Jekyll to turn back-end markdown pages into an HTML-based webpage.
From the GitHub introduction you can learn about how to navigate GitHub, write in Markdown, edit files and folders, work on different branches of a project, and sync your GitHub work with your local computer. All of these techniques are useful for working collaboratively on documentation and standards using GitHub.
Agri-food Data Canada is a partner in the recently announced Climate Smart Agriculture and Genomics project and is a member of the Data Hub. One of our outputs as part of this team has been the introduction to GitHub documentation.
Written by Carly Huitema
I have been attending industry-focused meetings over the past month and I’m finding the different perspectives regarding agri-food data very interesting and want to bring some of my thoughts to light.
I first want to talk about my interpretation of the academic views. In research and academia we focus on Research Data Management, how and where does data fit into our research. How can and should we make the data FAIR? During a research project, our focus is on what data to collect, how to collect without bias, how to clean it so we can use it for analysis and eventually draw conclusions to our research question. We KNOW what we are collecting since we DECIDE what we’re collecting. In my statistics and experimental design classes, I would caution my students to only collect what they need to answer their research question. We don’t go off collecting data willy-nilly or just because it looks interesting or fun or because it’s there – there is a purpose.
I’ve also been talking about OAC’s 150th anniversary and how we have been conducting research for many years, yet, the data is no where to be found! Ok, yes I am biased here – as I, personally, want to see all that historical data captured, preserved, and accessible if possible – in other words FAIR. But… what happens when you find those treasure troves of older data and there is little to no documentation? Or the principal investigator has passed on? Do you let the data go? Remember, how I love puzzles and I see these treasure troves as a puzzle – but…. When do you decide that it is not worth the effort? How do you decide what stays and what doesn’t? These are questions that data curators around the world are asking – and ones I’ve been struggling with lately. There is NO easy answer!
In academia, we’ve been working with data and these challenges for decades – now let’s turn our attention to the agri-food industry. Here data has also been collected for decades or more as well – but the data could be viewed more as “personal” data. What happened on my fields or with my animals. Sharing would happen by word of mouth, maybe a local report, or through extension work. Today, though, the data being collected on farms is enormous and growing by the minute – dare I say. As a researcher, I get excited at all that information being collected, but… on a more practical basis – the best way to describe this was penned by a colleague who works in industry – as “So What!”.
Goes back to my statement that we should only collect data that is relevant to our research question. The amount and type of data being collected by today’s farming technology is great but – what are we doing with it? Are producers using it? Is anyone using it? I don’t want to bring the BIG question of data ownership here – so let’s stay practical for a moment – and think about WHY is all that data being collected? WHAT is being done with that data? WHO is going to use it? Oh the questions keep coming – but you get the idea!
In the one meeting I attended – the So What question really resonated with me. We can collect every aspect of what is happening with our soils and crops – but if we can’t use the data when we need it and how we need it – what’s the point?
Yes, I’ve been rambling a bit here, trying to navigate this world of data! So many reasons to make data FAIR and just as many reasons to question making it FAIR. Just as a researcher creates a research question to guide their research, I think we all need to consider the W5 of collecting data: WHO is collecting it, WHAT is being collected, WHERE is it being collected and stored, WHEN is it being collected – on the fly or scheduled, WHY this is the big one!!
A lot to ponder here….
![]()
In today’s data-driven research environment, universities face a growing challenge: while researchers excel at pushing the boundaries of knowledge, they often face challenges managing the technology that supports their work.
Many university research teams still operate on isolated, improvised systems for computing and data storage—servers tucked in closets or offices, ad-hoc storage solutions, and no consistent approach to backups or security. These isolated systems may meet immediate needs but often creates inefficiencies, security risks, and lost opportunities for collaboration and innovation.
In this blog series, we’ll explore how research teams at universities in general can benefit by identifying their community commonalities and consolidating their IT infrastructure. A unified system, professionally managed by a dedicated research IT team, brings enhanced security, greater scalability, improved collaboration, and increased efficiency to researchers, allowing them to focus on discovery, not IT overhead. We’ll break down the benefits of this shift and how it can help research institutions thrive in today’s data-intensive landscape. Specifically, we will describe how a Collaborative Research IT Infrastructure might help University of Guelph researchers meet their IT needs while freeing up researchers’ time to focus on their core research objectives rather than the underlying IT infrastructure.
What You Can Expect from This Series
Post 1: The Problem with Doing It All Yourself
We’ll kick off by examining the issues that arise when research teams manage their own IT infrastructure—uncoordinated systems, security vulnerabilities, inefficient storage, and the burden of maintaining it all. We’ll explore the risks and costs of decentralized research IT infrastructure and the toll it takes on research productivity.
Posted on Nov 29 and available here.
Post 2: Why a Shared Infrastructure Makes Sense
Next, we’ll explore the advantages of moving to a shared research compute and storage system. From cost savings to enhanced security and easier scalability, we’ll show how a well-managed, shared resource pool can transform the way researchers handle data, computations, and infrastructure, giving them access to state-of-the-art tools and adding scalability by leveraging idle capacity from other research groups.
Post 3: Debunking the Myths: Research Autonomy in a Shared System
A common concern is that adopting a shared infrastructure means losing control. In this post, we’ll discuss how a collaborative system can actually increase flexibility, offering tailored environments for different research needs, while freeing researchers from the technical burdens of IT management. We’ll also explore how it fosters easier collaboration across departments and institutions.
Post 4: The Benefits of Shared Storage
Research generates vast amounts of data, and managing it efficiently is key to success. This post will look at how shared storage solutions offer more than just space—providing reliable backups, cost-effective scaling, and multiple storage tiers to meet various research needs, from active datasets to long-term archives.
Post 5: Scaling for the Future: Building a System That Grows with Your Research
As research projects evolve, so do their IT demands. This post will highlight how shared infrastructure offers scalability and adaptability, ensuring that universities can support growing data and computational needs. We’ll also discuss how investing in shared systems today sets universities up to leverage future advancements in research computing.
Post 6: Transitioning to a Shared System: Key Considerations
In our final post, we’ll discuss key considerations for the University of Guelph to explore the move to a shared research compute and storage system. We’ll look at the importance of securing sustainable funding, fostering consensus across departments, and navigating shared governance to ensure all voices are heard. Additionally, we’ll examine how existing organizational structures influence the establishment of dedicated roles for managing this infrastructure. This discussion aims to highlight the factors that can guide a smooth transition toward a collaborative research IT environment.
The Case for Change
By the end of this series, you’ll have a clear understanding of why shared research infrastructure is the future for universities. We’ll show that this approach isn’t just about technology—it’s about improving collaboration, safeguarding data, and ultimately empowering researchers to focus on what really matters: driving innovation. Join us as we explore the journey from siloed systems to shared success.
Written by Lucas Alcantara
Featured picture generated by Pixlr
There is a new feature just released in the Semantic Engine!
Now, after you have written your schema you can use this schema to enter and verify data using your web browser.
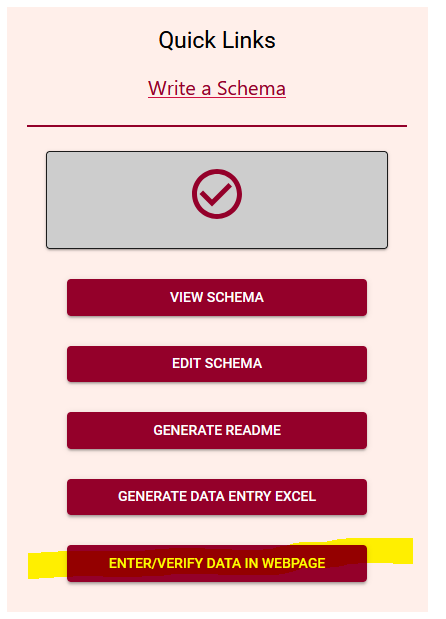
Find the link to the new tool in the Quick Link lists, after you have uploaded a schema. Watch our video tutorial on how to easily create your own schema.
Add data
The Data Entry Web tool lets you upload your schema and then you can optionally upload a dataset. If you choose to upload a dataset, remember that Agri-food Data Canada and the Semantic Engine tool never receive your data. Instead, your data is ‘uploaded’ into your browser and all the data processing happens locally.
If you don’t want to upload a dataset, you can skip this step and go right to the end where you can enter and verify your data in the web browser. You add rows of blank data using the ‘Add rows’ button at the bottom and then enter the data. You can hover over the ?’s to see what data is expected, or click on the ‘verification rules’ to see the schema again to help you enter your data.
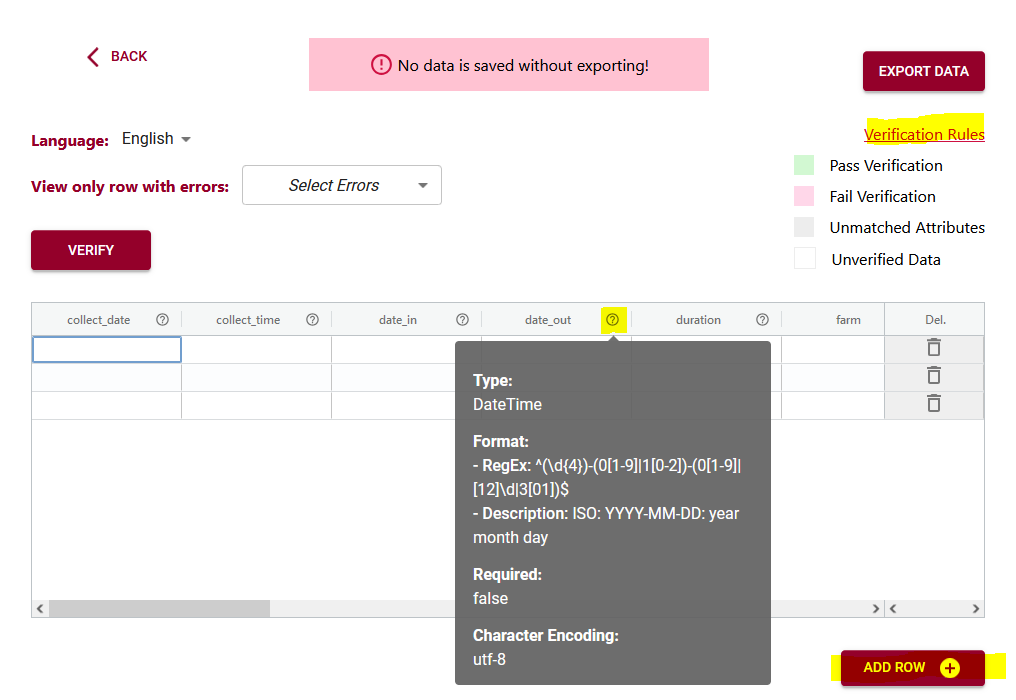
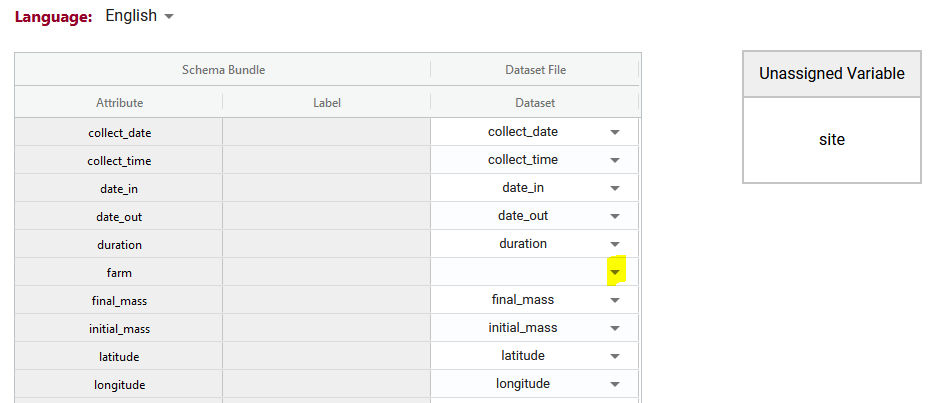
If you upload your dataset you will be able to use the ‘match attributes’ feature. If your schema and your dataset use the same column headers (aka variables or attributes), then the DEW tool will automatically match those columns with the corresponding schema attributes. Your list of unmatched data column headers are listed in the unassigned variables box to help you identify what is still available to be matched. You can create a match by selecting the correct column name in the associated drop-down. By selecting the column name you can unmatch an assigned match.
Matching data does two things:
1) Lets you verify the data in a data column (aka variable or attribute) against the rules of the schema. No matching, no verification.
2) When you export data from the DEW tool you have the option of renaming your column names to the schema name. This will automate future matching attempts and can also help you harmonize your dataset to the schema. No matching, no renaming.
Verify data
After you have either entered or ‘uploaded’ data, it is time to use one of the important tools of DEW – the verification tool! (read our blog post about why it is verification and not validation).
Verification works by comparing the data you have entered against the rules of the schema. It can only verify against the schema rules so if the rule isn’t documented or described correctly in the schema it won’t verify correctly either. You can always schedule a consultation with ADC to receive one-on-one help with writing your schema.
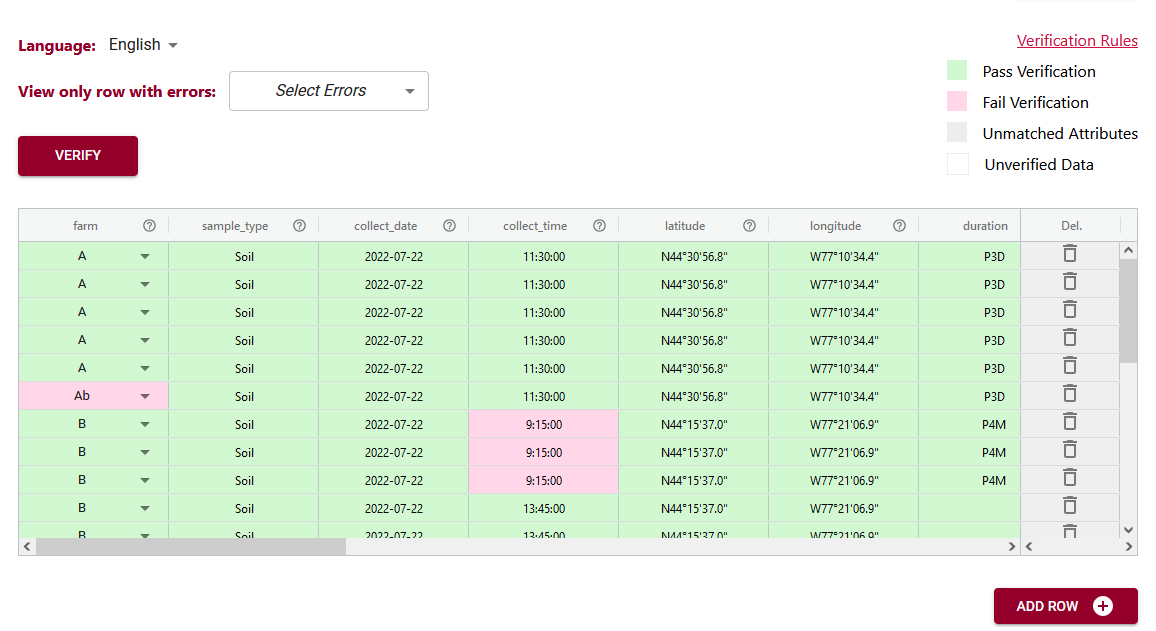
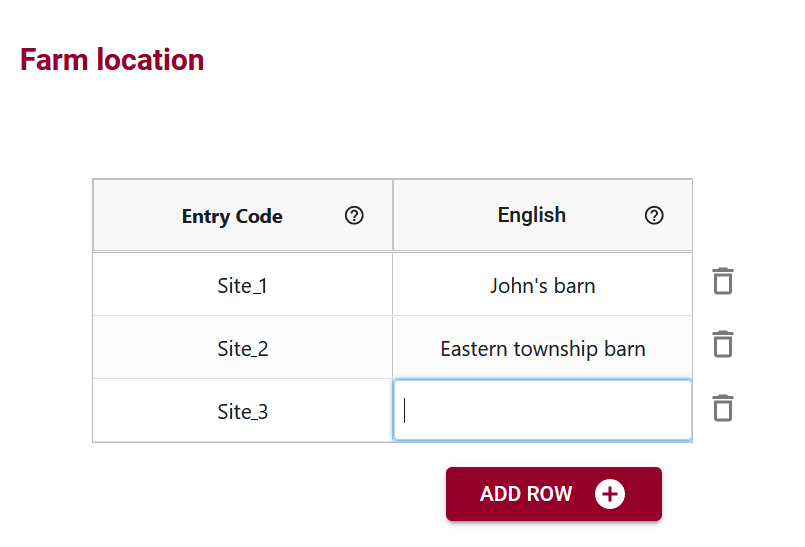
In the above example you can see the first variable/attribute/column is called farm and the DEW tool displays it as a list to select items from. In your schema you would set this feature up by making an attribute a list (aka entry codes). The other errors we can see in this table are the times. When looking up the schema rules (either via the link to verification rules which pops up the schema for reference, or by hovering over the column’s ?) you can see the expected time should be in ISO standard (HH:MM:SS), which means two digits for hour. The correct times would be something like 09:15:00. These format rules and more are available as the format overlay in the Semantic Engine when writing your schema. See the figure below for an example of adding a format rule to a schema using the Semantic Engine.

Export data
A key thing to remember, because ADC and the Semantic Engine don’t ever store your data, if you leave the webpage, you lose the data! After you have done all the hard work of fixing your data you will want to export the data to keep your results.
You have a few choices when you export the data. If you export to .csv you have the option of keeping your original data headers or changing your headers to the matched schema attributes. When you export to Excel you will generate an Excel following our Data Entry Excel template. The first sheet will contain all the schema documentation and then next sheet will contain your data with the matching schema attribute names.
The new Data Entry Web tool of the Semantic Engine can help you enter and verify your data. Reuse your schema and improve your data quality using these tools available at the the Semantic Engine.
Written by Carly Huitema
How should you organize your files and folders when you start on a research project?
Or perhaps you have already started but can’t really find things.
Did you know that there is a recommendation for that? The TIER protocol will help you organize data and associated analysis scripts as well as metadata documentation. The TIER protocol is written explicitly for performing analysis entirely by scripts but there is a lot of good advice that researchers can apply even if they aren’t using scripts yet.
“Documentation that meets the specifications of the TIER Protocol contains all the data, scripts, and supporting information necessary to enable you, your instructor, or an interested third party to reproduce all the computations necessary to generate the results you present in the report you write about your project.” [TIER protocol]
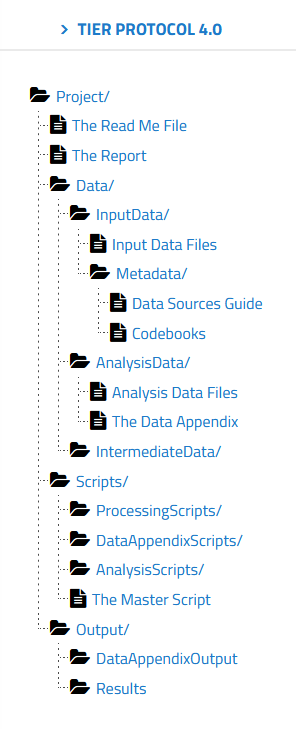
If you go to the TIER protocol website, you can explore the folder structure and read about the contents of each folder. You have folders for raw data, for intermediate data, and data ready for analysis. You also have folders for all the scripts used in your analysis, as well as any associated descriptive metadata.
You can use the Semantic Engine to write the schema metadata, the data that describes the contents of each of your datasets. Your schemas (both the machine-readable format and the human-readable .txt file) would go into metadata folders of the TIER protocol. The TIER protocol calls data schemas “Codebooks”.
Remember how important it is to never change raw data! Store your raw collected data before any changes are made in the Input Data Files folder and never! ever! change the raw data. Make a copy to work from. It is most valuable when you can work with your data using scripts (and stored in the scripts folder of the TIER protocol) rather than making changes to the data directly via (for example) Excel. Benefits include reproducibility and the ease of changing your analysis method. If you write a script you always have a record of how you transformed your data and anyone who can re-run the script if needed. If you make a mistake you don’t have to painstakingly go back through your data and try and remember what you did, you just make the change in the script and re-run it.
The TIER protocol is written explicitly for performing analysis entirely by scripts. If you don’t use scripts to analyze your data or for some of your data preparation steps you should be sure to write out all the steps carefully in an analysis documentation file. If you are doing the analysis for example in Excel you would document each manual step you make to sort, clean, normalize, and subset your data as you develop your analysis. How did you use a pivot table? How did decide which data points where outliers? Why did you choose to exclude values from your analysis? The TIER protocol can be imitated such that all of this information is also stored in the scripts folder of the TIER protocol.
Even if you don’t follow all the directions of the TIER protocol, you can explore the structure to get ideas of how to best manage your own data folders and files. Be sure to also look at advice on how to name your files as well to ensure things are very clear.
Written by Carly Huitema
Findable
Accessible (where possible)
Interoperable
Reusable
I believe most of us are now familiar with this acronym? The FAIR principles published in 2016. I have to admit that part of me really wants to create a song around these 4 words – but I’ll save you all from that scary venture. Seriously though, how many of us are aware of the FAIR principles? Better yet, how many of us are aware of the impact of the FAIR principles? Over my next blog posts we’ll take a look at each of the FAIR letters and I’ll pull them all together with the RDM posts – YES there is a relationship!
So, YES I’m working backwards and there’s a reason for this. I really want to “sell” you on the idea of FAIR. Why do we consider this so important and a key to effective Research Data Management – oh heck it is also a MAJOR key to science today.
R is for Reusable
Reusable data – hang on – you want to REUSE my data? But I’m the only one who understands it! I’m not finished using it yet! This data was created to answer one research question, there’s no way it could be useful to anyone else! Any of these statements sound familiar? Hmmm… I may have pointed some of these out in the RDM posts – but aside from that – truthfully, can you relate to any of these statements? No worries, I already know the answer and I’m not going to ask you to confess to believing or having said or thought any of these. Ah I think I just heard that community sigh of relief 🙂
So let’s look at what can happen when a researcher does not take care of their data or does not put measures into place to make their data FAIR – remember we’re concentrating on the R for reusability today.
Reproducibility Crisis?
Have you heard about the reproducibility crisis in our scientific world? The inability to reproduce published studies. Imagine statements like this: “…in the field of cancer research, only about 20-25% of the published studies could be validated or reproduced…”? (Miyakawa, 2020). How scary is that? Sometimes when we think about reproducibility and reuse of our data – questions that come to mind – at least my mind – why would someone want my data? It’s not that exciting? But boys oh boys when you step back and think about the bigger picture – holy cow!!! We are not just talking about data in our little neck of the woods – this challenge of making your research data available to others – has a MUCH broader and larger impact! 20-25% of published studies!!! and that’s just in the cancer research field. If you start looking into this crisis you will see other numbers too!
So, really what’s the problem here? Someone cannot reproduce a study – maybe it’s age of the equipment, or my favourite – the statistical methodologies were not written in a way the reader could reproduce the results IF they had access to the original data. There are many reasons why a study may not be reproducible – BUT – our focus is the DATA!
The study I referred to above also talks about some of the issues the author encountered in his capacity as a reviewer. The issue that I want to highlight here is access to the RAW data or insufficient documentation about the data – aha!! That’s the link to RDM. Creating adequate documentation about your data will only help you and any future users of your data! Many studies cannot by reproduced because the raw data is NOT accessible and/or it is NOT documented!
Pitfalls to NO Reusable data
There have been a few notable researchers that have lost their career because of their data or rather lack thereof. One notable one is Brian Wansink, formerly of Cornell University. His research was ground-breaking at the time, studying eating habits, looking at how cafeterias could make food more appealing to children, it was truly great stuff! BUT….. when asked for the raw data….. that’s when everything fell apart. To learn more about this situation follow the link I provided above that will take you to a TIME article.
This is a worst case scenario – I know – but maybe I am trying to scare you! Let’s start treating our data as a first class citizen and not an artifact of our research projects. FAIR data is research data that should be Findable, Accessible (where possible), Interoperable, and REUSABLE! Start thinking beyond your study – one never knows when the data you collected during your MSc or PhD may be crucial to a study in the future. Let’s ensure it’s available and documented – remember Research Data Management best practices – for the future.
![]()
In the rapidly evolving landscape of livestock research, the ability to harness data from diverse sources is paramount. From sensors monitoring animal health to weather data influencing grazing patterns, the insights derived from integrated data can drive informed decisions and innovative solutions. However, integrating data into a centralized livestock research database presents a myriad of challenges that require careful consideration and robust solutions.
Challenges of Data Integration:
- Diverse Data Sources: Livestock research generates data from a multitude of sources, including sensors, health monitoring devices, laboratory tests, and manual observations. Each source may produce data in different formats and structures, complicating the integration process.
- Data Quality and Consistency: Ensuring data quality and consistency across disparate sources is crucial for meaningful analysis and interpretation. Discrepancies in data formats, missing values, and inconsistencies pose significant challenges that must be addressed.
- Real-Time Data Flow: In the dynamic environment of livestock research, timely access to data is essential. Establishing systems for continuous data flow ensures that researchers have access to the latest information for analysis and decision-making.
Solutions for Seamless Data Integration:
- Standardized Data Formats: Implementing standardized data formats, such as JSON or CSV, facilitates easier integration across different sources. By establishing data standards, organizations can streamline the integration process and improve interoperability.
- Data Governance and Quality Assurance: Developing robust data governance policies and quality assurance processes helps maintain data integrity throughout the integration pipeline. Regular audits, validation checks, and data cleaning protocols ensure that only high-quality data is integrated into the research database.
- APIs and Data Pipelines: Leveraging application programming interfaces (APIs) and data pipelines enables automated data retrieval and integration from various sources. APIs provide a standardized way to access and transmit data, while data pipelines automate the flow of data, ensuring seamless integration and synchronization.
- Data Synchronization and Monitoring: Implementing mechanisms for data synchronization and monitoring ensures that data flows continuously and is not missing. Regular checks and alerts can notify database administrators of any disruptions in data flow, allowing for timely resolution.
Conclusion:
In the pursuit of advancing livestock research, data integration plays a pivotal role in unlocking valuable insights and driving innovation. By addressing the challenges associated with integrating data from diverse sources and formats, organizations can create a centralized research database that serves as a foundation for evidence-based decision-making and scientific discovery. Through standardized formats, robust governance practices, and automated data pipelines, seamless data integration becomes achievable, empowering researchers to harness the full potential of data in advancing livestock management and welfare.
Written by Lucas Alcantara
We first talked about writing filenames back in a post about Organizing your data: Research Data Management (RDM)
To further improve your filenaming game, check out a naming convention worksheet from Caltech that helps researchers create a great filenaming system that works with their workflows.
Example: My file naming convention is “SA-MPL-EID_YYYYMMDD_###_status.tif” Examples are “P1-MUS-023_20200229_051_raw.tif” and “P2-DRS-285_20191031_062_composite.tif”.
Why standardize file names?
Standardizing file naming conventions helps researchers better organize their own work and collaborate with others. Here are some key benefits of adopting standardized file naming conventions:
Consistency:
Standardized file naming ensures a consistent structure across files, making it easier for researchers to locate and identify documents. This consistency reduces confusion and streamlines file management.
Improved Searchability:
A standardized naming convention makes searching easier. Users can quickly locate files based on keywords, project names, or other relevant information embedded in the file names, reducing the time spent searching for specific documents.
Ease of Sorting:
Uniform file names make it easier to sort and arrange files in alphabetical or chronological order. This aids in maintaining an organized file structure, especially when dealing with a large volume of documents.
Enhanced Collaboration:
In collaborative environments (such as sharing data with your supervisor), standardized file naming promotes a shared understanding of how files are named and organized.
Version Control:
Including version numbers or dates in file names helps manage version control effectively. This is particularly important in situations where multiple iterations of a document are created, ensuring that users can identify the most recent or relevant version.
By adopting a consistent approach to file naming, researchers can improve their overall file management processes, prevent mistakes, and enhance productivity.
File organization:
Keep reading our blog for an upcoming post on file organization using the TIER protocol.
Written by Carly Huitema
How many of you document your statistical analysis code? SAS and R users, do you add comments in your programs? Or do you fly by the seat of your pants, write, modify code, and know that you’ll remember what you did at a later time? I know we don’t have the time to add all this information in our code, but I cannot stress enough how IMPORTANT it is to do something! I’ll use the same story as I did a few posts ago – and be honest! Will you 100% remember WHY you adjusted that weight variable? HOW you adjusted that weight variable? WHY you dropped that observation or the other? If you’re a paper person like myself – you may have written it down in your lab or notebook. Fabulous! BUT! What happens to your notes when you archive your data and associated statistical programs?
Many if not all of the statistical programs that you are using have the ability to add comments among your code. This is the easiest way to start documenting your statistical analysis. When you archive your data, you will also archive your statistical analysis programs (.sas and .r are text files), so future users of your data will understand how your data was created. Yes, there are other options to capture your documentation, one of these is Markdown. Imagine writing your SAS or R code, adding documentation explaining what you do as you work through the code AND adding documentation to your output – all at the same time!
If you’re curious how Markdown works for both R and SAS, review this tutorial “Saving your code and making your research REPRODUCIBLE”. A more recent workshop demonstrating how to use R Markdown for R processes can be found at the Agri-food Research Data Workshop Series: Workshop 6: Documenting your Data and Processes with R Markdown .
Enjoy! And remember if you have any questions or comments – please let us know at adc@uoguelph.ca
![]()
Maintaining data quality can be a constant challenge. One effective solution is the use of entry codes. Let’s explore what entry codes entail, why they are crucial for clean data, and how they are seamlessly integrated into the Semantic Engine using Overlays Capture Architecture (OCA).
Understanding Entry Codes in Data Entry
Entry codes serve as structured identifiers in data entry, offering a systematic approach to input data. Instead of allowing free-form text, entry codes limit choices to a predefined list, ensuring consistency and accuracy in the dataset.
The Need for Clean Data
Data cleanliness is essential for meaningful analysis and decision-making. Without restrictions on data entry, datasets often suffer from various spellings and abbreviations of the same terms, leading to confusion and misinterpretation.
Practical Examples of Entry Code Implementation
Consider scenarios in scientific research where specific information, such as research locations, gene names, or experimental conditions, needs to be recorded. Entry codes provide a standardized framework, reducing the likelihood of inconsistent data entries.
Overcoming Cleanup Challenges
In the past, when working with datasets lacking entry codes, manual cleanup or tools like Open Refine were essential. Open Refine is a useful data cleaning tool that lets users standardize data after collection has been completed.
Leveraging OCA for Improved Data Management
Overlays Capture Architecture (OCA) takes entry codes a step further by allowing the creation of lists to limit data entry choices. Invalid entries, those not on the predefined list (entry code list), are easily identified, enhancing the overall quality of the dataset.
Language-specific Labels in OCA
OCA introduces a noteworthy feature – language-specific labels for entry codes. In instances like financial data entry, where numerical codes may be challenging to remember, users can associate user-friendly labels (e.g., account names) with numerical entry codes. This ensures ease of data entry without compromising accuracy.
Multilingual Support for Global Usability
OCA’s multilingual support adds a layer of inclusivity, enabling the incorporation of labels in multiple languages. This feature facilitates international collaboration, allowing users worldwide to engage with the dataset in a language they are comfortable with.
Crafting Acceptable Data Entries in OCA
When creating lists in OCA, users define acceptable data entries for specific attributes. Labels accompanying entry codes aid users in understanding and selecting the correct code, contributing to cleaner datasets.
Clarifying the Distinction between Labels and Entry Codes
It’s important to note that, in OCA, the emphasis is on entry codes rather than labels. While labels provide user-friendly descriptions, it is the entry code itself that becomes part of the dataset, ensuring data uniformity.
In conclusion, entry codes play an important role in streamlining data entry and enhancing the quality of datasets. Through the practical implementation of entry codes supported by Overlays Capture Architecture, organizations can ensure that their data remains accurate, consistent, and accessible on a global scale.