Funding for Agri-food Data Canada is provided in part by the Canada First Research Excellence Fund
Overlays Capture Architecture
Expanding how we model, interpret, and collect complex data
The latest update to the Semantic Engine Schemas tool introduces a set of improvements that push the tool well beyond its earlier focus on simple tabular data. These changes make it easier to describe complex data structures, document real-world datasets more accurately, and even support user interfaces built directly from schemas.
At the same time, some of the updates, especially around recovery and validation, come with important caveats that users should understand to use the tool effectively.
Safer Editing
One of the most noticeable improvements is the addition of automatic, behind-the-scenes storage. As you work, the tool now saves a representation of your schema in your browser’s local storage and can attempt to restore it if your session is interrupted.
This is particularly helpful in situations where:
- A browser tab is accidentally closed
- A session times out
- The page reloads unexpectedly
However, it is critical to understand what this feature is – and what it is not.
This is an emergency recovery mechanism, not a primary workflow.
Browser-based storage can be unreliable. It may be cleared, overwritten, or fail depending on the environment. For that reason:
- You should not rely on recovery as a way of saving work
- You should still complete and download your schema explicitly
- Your workflow should always end with a saved schema file that can be reloaded into the Semantic Engine later
In other words, recovery is a safety net – not a substitute for good versioning and saving practices.
Moving Beyond Tables: Child Schemas
A major conceptual shift in this update is the introduction of child schemas, which allow one schema to reference another.
This change enables schemas to describe nested or hierarchical data structures, rather than being limited to flat tables.
For example, instead of squeezing complex relationships into a single table, you can now model:
- A dataset where one record contains multiple related entries
- Repeating groups of information (such as survey responses or event logs)
- Structured objects that naturally contain sub-objects
However, this added flexibility introduces complexity. In particular:
- Validation becomes more difficult
- Relationships between nested components must be checked
- The existing tabular verification tools are not sufficient for these cases
As a result, working with child schemas may require custom validation approaches or additional tooling. This is an area where the ecosystem around the Semantic Engine will likely continue to evolve.
Better Describing Real-World Data: Separator Overlays
Another important improvement addresses a common but often overlooked challenge: data formatting inconsistencies.
In practice, formats like CSV are not as standardized as their name suggests. Different datasets may use:
- Different delimiters (commas, semicolons, tabs)
- Different decimal separators (e.g.,
1.23vs1,23) - Custom separators for arrays within a single field
The updated overlays now allow schema authors to explicitly define these details.
With the new features, you can:
- Specify the delimiter used for arrays in a field
- Define the decimal separator used in numeric values
- Clarify how a dataset structures its rows and columns
This is especially valuable in international contexts. For example, many European datasets use a comma as a decimal separator, which often leads to semicolons being used as column delimiters.
By capturing these details in the schema:
- Humans can more easily understand how to read the data
- Machines can parse datasets more accurately and consistently
- Misinterpretation errors can be significantly reduced
This update reinforces an important idea: a schema should describe not just what data means, but also how it is encoded.
From Data Models to Interfaces: The Form Information Overlay
One of the most forward-looking additions is the Form Information overlay, which allows schemas to describe how data should be collected from users.
In effect, a schema can now double as a blueprint for a form or questionnaire.
Rather than only defining fields and data types, schemas can also include:
- Information about how fields should be presented
- Organizational structure for grouping inputs
- Guidance for building user-facing forms
This does not automatically create forms on its own. Instead, tools must interpret this overlay and render an interface accordingly.
Currently, this is already supported by:
- The Records tool
- The Data Request Tracker (DRT)
This integration is significant because it connects two areas that are often separated:
- Data modeling
- Data collection
By aligning these, the Semantic Engine supports a workflow where a single schema can guide both how data is structured and how it is gathered.
A Step Toward an Integrated Ecosystem
Taken together, these updates represent more than just new features they expand on how the Semantic Engine can be used.
The Schemas tool is evolving into a foundation for a broader ecosystem, where schemas can be:
- Created and iterated safely (with recovery as backup)
- Structured in complex, nested ways
- Used to interpret varied real-world datasets
- Consumed by other tools that handle records and workflows
Some key takeaways from this update include:
- Always finalize and download your schema—recovery is only a fallback
- Use child schemas to model complex data, but be prepared for more advanced validation needs
- Leverage overlays to document data formats clearly and reduce ambiguity
- Explore form overlays to connect schemas with user-facing tools
Final Thoughts
This update marks an important step forward for the Semantic Engine. It expands what schemas can represent, improves how datasets can be described, and begins to bridge the gap between data definition and practical use.
In research environments, effective data management depends on clarity, transparency, and interoperability. As datasets grow in complexity and scale, institutions must ensure that research data is FAIR; not only accessible but also well-documented, interoperable, and reusable across diverse systems and contexts in research Data Spaces.
The Semantic Engine (which runs OCA Composer), developed by Agri-Food Data Canada (ADC) at the University of Guelph, addresses this need.
What is the OCA Composer
The OCA Composer is based on the Overlays Capture Architecture (OCA), an open standard for describing data in a structured, machine-readable format. Using OCA allows datasets to become self-describing, meaning that each element, unit, and context is clearly defined and portable.
This approach reduces reliance on separate documentation files or institutional knowledge. Instead, OCA schemas ensure that the meaning of data remains attached to the data itself, improving how datasets are shared, reused, and integrated over time. This makes data easier to interpret for both humans and machines.
The OCA Composer provides a visual interface for creating these schemas. Researchers and data managers can build machine-readable documentation without programming skills, making structured data description more accessible to those involved in data governance and research.
Why Use OCA Composer in your Data Space
Implementing standards can be challenging for many Data Spaces and organizations. The OCA Composer simplifies this process by offering a guided workflow for creating structured data documentation. This can help researchers:
- Standardize data descriptions across projects and teams
- Improve dataset discoverability and interoperability
- Support collaboration through consistent documentation templates (e.g. Data Entry Excel)
- Increase transparency and trust in data definitions
By making metadata a central part of data management, researchers can strengthen their overall data strategy.
Integration and Customization
The OCA Composer can support the creation and running of Data Spaces by organizations, departments, research projects and more. These Data Spaces often have unique digital environments and branding requirements. The OCA Composer supports this through embedding and white labelling features. These allow the tool to be integrated directly into existing platforms, enabling users to create and verify schemas while remaining within the infrastructure of the Data Space. Institutions can also apply their own branding to maintain a consistent visual identity.
This flexibility means the Composer can be incorporated into internal portals, research management systems, or open data platforms including Data Spaces while preserving organizational control and customization.
To integrate the OCA Composer in your systems or Data Space, check out our more technical details. Alternatively, consult with Agri-food Data Canada for help, support or as a partner in your grant application.
Written by Ali Asjad and Carly Huitema
Streamlining Data Documentation in Research
In of research, data documentation is often a complex and time-consuming task. To help researchers better document their data ADC has created the Semantic Engine as a powerful tool for creating structured, machine-readable data schemas. These schemas serve as blueprints that describe the various features and constraints of a dataset, making it easier to share, verify, and reuse data across projects and disciplines.
Defining Data
By guiding users through the process of defining their data in a standardized format, the Semantic Engine not only improves data clarity but also enhances interoperability and long-term usability. Researchers can specify the types of data they are working with, the descriptions of data elements, units of measurement used, and other rules that govern their values—all in a way that computers can easily interpret.
Introducing Range Overlays
With the next important update, the Semantic Engine now includes support for a new feature: range overlays.
Range overlays allow researchers to define expected value ranges for specific data fields, and if the values are inclusive or exclusive (e.g. up to but not including zero). This is particularly useful for quality control and verification. For example, if a dataset is expected to contain only positive values—such as measurements of temperature, population counts, or financial figures—the range overlay can be used to enforce this expectation. By specifying acceptable minimum and maximum values, researchers can quickly identify anomalies, catch data entry errors, and ensure their datasets meet predefined standards.
Verifying Data
In addition to enhancing schema definition, range overlay support has now been integrated into the Semantic Engine’s Data Verification tool. This means researchers can not only define expected value ranges in their schema, but also actively check their datasets against those ranges during the verification process.
When you upload your dataset into the Data Verification tool—everything running locally on your machine for privacy and security—you can quickly verify your data within your web browser. The tool scans each field for compliance with the defined range constraints and flags any values that fall outside the expected bounds. This makes it easy to identify and correct data quality issues early in the research workflow, without needing to write custom scripts or rely on external verification services.
Empowering Researchers to Ensure Data Quality
Whether you’re working with clinical measurements, survey responses, or experimental results, this feature lets you to catch outliers, prevent errors, and ensure your data adheres to the standards you’ve set—all in a user-friendly interface.
Written by Carly Huitema
In our ongoing exploration of using the Semantic Engine to describe your data, there’s one concept we haven’t yet discussed—but it’s an important one: cardinality.
Cardinality refers to the number of values that a data field (specifically an array) can contain. It’s a way of describing how many items you’re expecting to appear in a given field, and it plays a crucial role in data descriptions, verification, and interpretation.
What Is an Array?
Before we talk about cardinality, we need to understand arrays. In data terms, an array is a field that can hold multiple values, rather than just one.
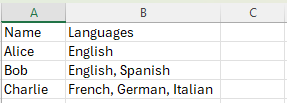
For example, imagine a dataset where you’re recording the languages a person speaks. Some people might speak only one language, while others might speak three or more. Instead of creating separate fields for “language1”, “language2”, and so on, you might store them all in one field as an array.
In an Excel spreadsheet, this might look like:
Written by Carly Huitema
Short answer: Not really — but also, kind of.
Why you can’t just use an LLM to write a schema
At first glance, writing an OCA (Overlays Capture Architecture) schema might seem simple. After all, it’s just JSON, and tools like ChatGPT or Microsoft Copilot are great at generating structured text. But when it comes to OCA schemas, large language models (LLMs) run into two big limitations:
-
LLMs struggle with exact syntax.
LLMs don’t truly “understand” JSON or schema structures — they generate text by predicting what comes next based on patterns. This means their output might look right but contain subtle errors like missing brackets, incorrect fields, or made-up syntax. Fixing these issues often requires manual correction. -
LLMs can’t calculate digests.
OCA schemas use cryptographic digests — unique strings calculated from the exact contents of the schema. If the schema changes, even slightly, the digest must be recalculated. But LLMs can’t compute these digests — that requires separate code. Without the correct digests, an OCA schema isn’t valid.
Why you kind of can
That said, LLMs can still play a useful role in the schema-writing process.
With the right prompt, an LLM can generate a nearly-correct OCA JSON schema package. While it won’t include valid digests (and may need a few syntax tweaks to fix it enough to be recognized by the Semantic Engine), the Semantic Engine can import this “almost right” schema and help correct remaining errors. Once inside the Semantic Engine, it can calculate the proper digests and export a valid OCA schema package.
This approach is especially helpful if you already have schema information in a structured format — like an Excel table — and want to save time converting it into JSON.
What does a prompt look like?
Here’s an example of a prompt that works well with LLMs to create OCA schema packages. You may need to adjust it for your specific case, but if you’ve got structured schema data, it can be a great starting point for working with the Semantic Engine.
Webpage containing LLM prompt to be copied in two parts.
In short, while you can’t use an LLM to fully generate a valid OCA schema on its own, you can use it to speed up the process — as long as you’re ready to do a bit of post-processing using a tool such as JSON formatter to validate and fix syntax and use the Semantic Engine to fill in the gaps.
Written by Carly Huitema
When designing a data schema, you’re not only choosing what data to collect but also how that data should be structured. Format rules help ensure consistency by defining the expected structure for specific types of data and are especially useful for data verification.
For example, a date might follow the YYYY-MM-DD format, an email address should look like name@example.com, and a DNA sequence may only use the letters A, T, G, and C. These rules are often enforced using regular expressions or standardized format types to validate entries and prevent errors. Using the Semantic Engine, we have already described how users can select format rules for data input. Now we introduce the ability to add custom format rules for your data verification.
Format rules are in Regex
Format rules that are understood by the Semantic Engine are written in a language called Regex.
Regex—short for regular expressions—is a powerful pattern-matching language used to define the format that input data must follow. It allows schema designers to enforce specific rules on strings, such as requiring that a postal code follow a certain structure or ensuring that a genetic code only includes valid base characters.
For example, a simple regex for a 4-digit year would be:^\d{4}$
This means the value must consist of exactly four digits.
Flavours of Regex
While regex is a widely adopted standard, it comes in different flavours depending on the programming language or system you’re using. Common flavours include:
-
PCRE (Perl Compatible Regular Expressions) – used in PHP and many other systems
-
JavaScript Regex – the flavour used in browsers and front-end validation
-
Python Regex (re module) – similar to PCRE with some minor syntax differences
-
POSIX – a more limited, traditional regex used in Unix tools like
grepandawk
The Semantic Engine uses a flavor of regex aligned with JavaScript-style regular expressions, so it’s important to test your patterns using tools or environments that support this style.
Help writing Regex
Regex is notoriously powerful—but also notoriously easy to get wrong. A misplaced symbol or an overly broad pattern can lead to incorrect validation or unexpected matches. You can use online tools such as ChatGPT and other AI assistants to help start writing and understanding your regex. You can also put in unknown Regex expressions and get explanations using an AI agent.
You can also use other online tools such as:
The Need for Testing
It’s essential to test your regular expressions before using them in your schema. Always test your regex with both expected inputs and edge cases to ensure your data validation is reliable and robust. With the Semantic Engine you can export a schema with your custom regex and then use it with a dataset with the data verification tool to test your regex.
By using regex effectively, the Semantic Engine ensures that your data conforms to the exact formats you need, improving data quality, interoperability, and trust in your datasets.
Written by Carly Huitema
Data schemas
Schemas are a type of metadata that provide context to your data, making it more FAIR (Findable, Accessible, Interoperable, and Reusable).
At their core, schemas describe your data, giving data better context. There are several ways to create a schema, ranging from simple to more complex. The simplest approach is to document what each column or field in your dataset represents. This can be done alongside your data, such as in a separate sheet within an Excel spreadsheet, or in a standalone text file, often referred to as a README or data dictionary.
However, schemas written as freeform text for human readers have limitations: they are not standardized and cannot be interpreted by machines. Machine-readable data descriptions offer significant advantages. Consider the difference between searching a library using paper card catalogs versus using a searchable digital database—machine-readable data descriptions bring similar improvements in efficiency and usability.
To enable machine-readability, various schema languages are available, including JSON Schema, JSON-LD, XML Schema, LinkML, Protobuf, RDF, and OCA. Each has unique strengths and use cases, but all allow users to describe their data in a standardized, machine-readable format. Once data is in such a format, it becomes much easier to convert between different schema types, enhancing its interoperability and utility.

Overlays Capture Architecture
The schema language Overlays Capture Architecture or OCA has two unique features which is why it is being used by the Semantic Engine.
- OCA embeds digests (specifically, OCA uses SAIDs)
- OCA is organized by features
Together these contribute to what makes OCA a unique and valuable way to document schemas.
OCA embeds digests
OCA uses digests which are digital fingerprints which can be used to unambiguously identify a schema. As digests are calculated directly from the content they identify this means that if you change the original content, the identifier (digest) also changes. Having a digital fingerprint calculated from the content is important for research reproducibility – it means you can find a digital object and if you have the identifier (digest) you can verify if the content has been changed. We have written a blog post about how digests are calculated and used in OCA.
OCA is organized by features
A schema describes the attributes of a dataset (typically the column headers) for a variety of features. A schema can be very simple and use very few features to describe attributes, but a more detailed schema will describe many features of each attribute.
We can represent a schema as a table, with rows for each attribute and a column for each feature.
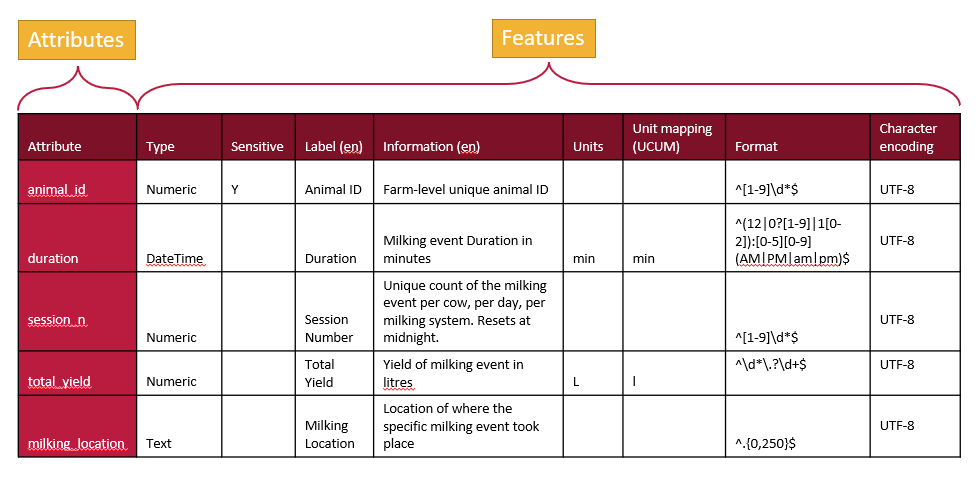
A tabular representation of a schema provides a clear overview of all the attributes and features used to describe a dataset. While schemas may be visualized as tables, they are ultimately saved and stored as text documents. The next step is to translate this tabular information into a structured text format that computers can understand.
From the table, there are two primary approaches to organizing the information in a text document. One method is to write it row by row, documenting an attribute followed by the values for each of its features. This approach, often called attribute-by-attribute documentation, is widely used in schema design such as JSON Schema and LinkML.
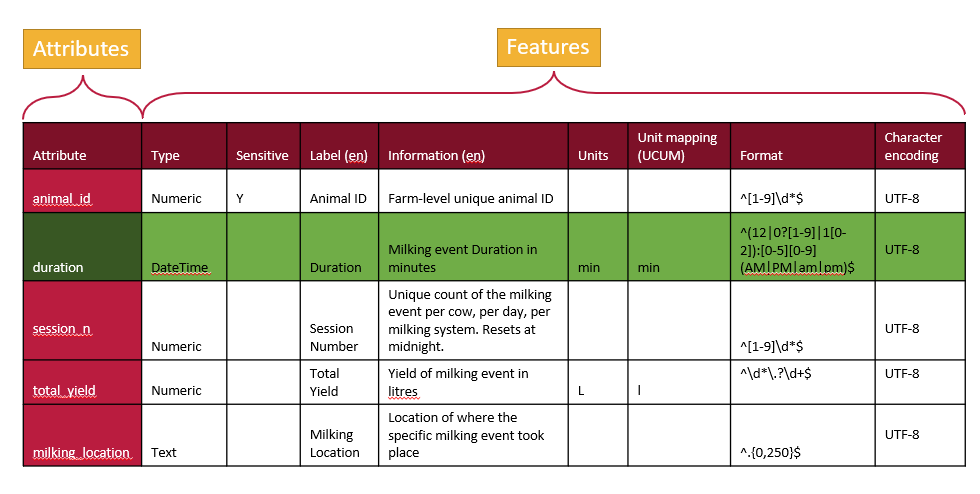
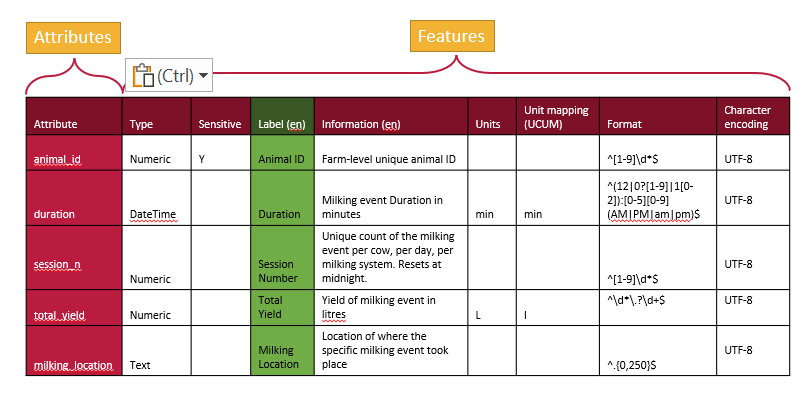
Schemas can also be written column by column, focusing on features instead of attributes. In this feature-by-feature approach (following the table in the figure above), you start by writing out all the data types for each attribute, then specify what is sensitive for each attribute, followed by providing labels, descriptions, and other metadata. These individual features, referred to as overlays in this schema architecture, offer a modular and flexible way to organize schema information. The Overlays Capture Architecture (OCA) is a global open overlay schema language that uses this method, enabling enhanced flexibility and modularity in schema design.
What is important for OCA is each overlay (feature) are given digests (the SAIDs). Each of the columns above is written out and a digest calculated and assigned, one digest for each feature. Then all the parts are put together and the entire schema is given a digest. In this way, all the content of a schema is bound together and it is never ambiguous about what is contained in a schema.
Why schema organization matters
Why does it matter whether schemas are written attribute-by-attribute or feature-by-feature? While we’ll explore this in greater detail in a future blog post, the distinction plays a critical role in calculating digests and managing governance in decentralized ecosystems.
A digest is a unique identifier for a piece of information, allowing it to be governed in a decentralized environment. When ecosystems of researchers and organizations agree on a specific digest (e.g., “version one schema” of an organization with digest xxx), they can agree on the schema’s validity and use.
A feature-by-feature schema architecture is particularly well-suited for governance. It offers flexibility by enabling individual features to be swapped, added, or edited without altering the core content of the data structure. Since the content remains unchanged, the digest also stays the same. This approach not only improves the schema’s adaptability but also enhances both the data’s and the schema’s FAIRness. This modularity ensures that schemas remain effective tools for collaboration and management in dynamic, decentralized ecosystems.
The Semantic Engine
All these details of an OCA schema are taken care of by the Semantic Engine. The Semantic Engine presents a user interface for generating a schema and writes the schema out in the language of OCA; feature by feature. The Semantic Engine calculates all the digests and puts them inside the schema document. It calculates the entire schema digest and it publishes that information when you export the schema. You can view all the digests (SAIDs) calculated for the schema in the readme.txt file.
Written by Carly Huitema
There are many high quality vocabularies, taxonomies and ontologies that researchers can use and incorporate into their schemas to help improve the quality and accuracy of their data. We’ve already talked about ontologies here in this blog but here we go into a few more details.
Semantic Objects
Vocabularies, ontologies, and taxonomies are examples of semantic objects or knowledge organization systems (KOS). These tools help structure, standardize, and manage information within a particular domain to ensure consistency, accuracy, and interoperability. They provide frameworks for organizing data, defining relationships between concepts, and enabling machines to understand and process information effectively.
Key Roles of Semantic Objects:
- Standardization: Encourage consistent use of terms across datasets and systems.
- Interoperability: Improve data sharing and integration by aligning different systems with shared meanings.
- Data Quality: Improve accuracy and reduce ambiguity in data collection and analysis.
- Machine-Readability: Enable automation, semantic search, and advanced data processing. Prepare data for AI.
These tools are foundational in disciplines such as bioinformatics, healthcare, and agriculture, contributing to better data management and enhanced research outcomes.
Vocabularies: A set of terms and their definitions used within a particular domain or context to ensure consistent communication and understanding.
Example: A glossary of medical terms.
Taxonomies: A hierarchical classification system that organizes terms or concepts into parent-child relationships, typically used to categorize information.
Example: The classification of living organisms into kingdom, phylum, class, order, family, genus, and species.
Ontologies: A formal representation of knowledge within a domain, including the relationships between concepts, often expressed in a way that can be processed by computers.
Example: The Gene Ontology, which describes gene functions and their relationships in a structured form.
Examples of terms
There are many vocabularies, taxonomies and ontologies (semantic objects) that you can use, or already using. For example, many researchers in genetics are familiar with GO, an ontology for genes. PubMed improves your search by using MeSH (Medical Subject Headings) as the NLM controlled vocabulary thesaurus used for indexing articles. The FoodON is a farm to fork ontology with many terms all related to food production including agriculture and processing.
Read more about semantic objects such as vocabularies, taxonomies and ontologies including how to select the right one for you at the FAIR cookbook.
Use your list of terms
You can use controlled lists of terms (derived from semantic objects) in your data collection in order to standardize the information you are recording. This is well understood for organism taxonomy (not making up new names when you are specifically describing a species) and in genetics (using standard gene names from an ontology such as GO). There are many other controlled terms you can find as well to help standardize your data collection and improve interoperability by incorporating controlled terms into a schema.
How to use terms in a schema
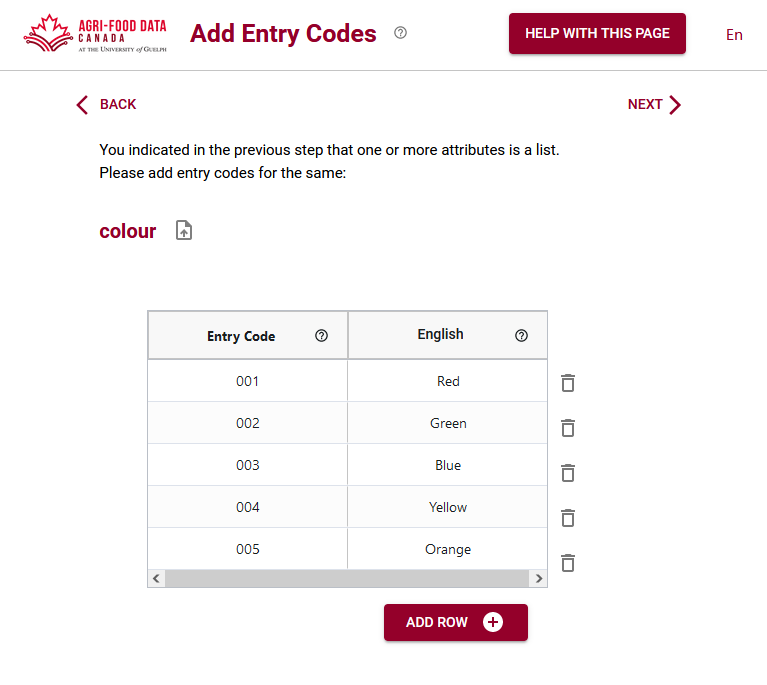
After you have identified a source of terms you need to get this information into a schema. The easiest way to do this using the Semantic Engine is to create a terms list as a .csv file from your source. Give your term list headings; for example terms from the GO ontology are usually fairly esoteric GO numbers and these can be the entry codes whereas more friendly labels can be given (in multiple languages) which can help with data entry. The entry codes are the information that is added to your data, so when it comes time to perform analysis your data will consist of the entry codes (and not the label).
Incorporating high-quality vocabularies, taxonomies, and ontologies into your schemas is an essential step to enhance data quality, consistency, and interoperability. Vocabularies provide standardized definitions for domain-specific terms, taxonomies offer hierarchical classification systems, and ontologies formalize knowledge structures with defined relationships, enabling advanced data processing and analysis. Examples such as GO, MeSH, and FoodON demonstrate how these semantic objects are already widely used in fields like genetics, healthcare, and food production.
By leveraging controlled lists of terms derived from these resources, researchers can ensure standardized data collection, improving both the accuracy and reusability of their datasets. Creating term lists in machine-readable formats like .csv files allows seamless integration into schemas, facilitating better data management and fostering compliance with FAIR data principles.
Written by Carly Huitema
If you have been already using the Semantic Engine to write your schemas you will have come across the .zip schema bundle. This is the machine-readable version of your schema written in JSON where each component of you schema is a separate file inside a .zip folder.
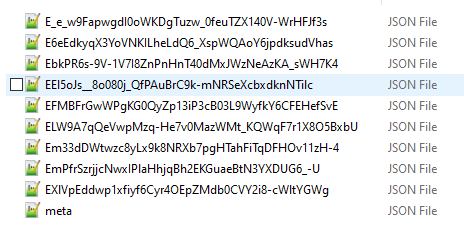
Overlays Capture Architecture has transitioned now to a schema package that has the same content with a few extra pieces of information and a new way to extend the functionalities of schemas. First, rather than each component of the schema being in a separate file inside a .zip, they are listed one after another inside a single .json file. The content of each schema component is the same and exists as the schema bundle. We found .zips were a problem for our Mac users especially and they were also challenging to include in repositories. The change to a single JSON object will address these challenges.
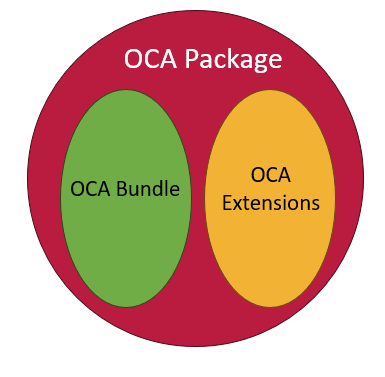
Second, ADC has extended the functionality of OCA to cover use cases that aren’t included in the original specification such as attribute ordering. These extra overlays follow the same syntax and structure of OCA and are in a second object called extensions. Both the OCA bundle and its extensions are included in a JSON file called OCA Package. You can read more about this update on the OCA Package specification.
Because OCA uses derived identifiers, this structure means we can give a derived identifier to the OCA Bundle which contains standard, well specified overlays. We also give researchers and developers flexibility to add their own functionalities via the OCA extensions where new additions won’t change the core bundle derived identifier. Finally, the entire OCA Package is given a derived identifier thus binding all the content together. When you reference your OCA schema you should use the Package identifier.
One of the first extensions we have added to an OCA schema is the ability to keep ordering of attributes. You may have noticed that in an OCA schema all the attributes are ordered alphabetically. Now with the ordering overlay we support user-entered ordering and this functionality is included now in all Semantic Engine tools.
The Semantic Engine can continue to consume and use .zip schema bundles but now the default will be to export .json schema packages. The .json packages will continue to be developed and so if you are using any .zip schema bundles you can open them using the Semantic Engine and export them to obtain the .json version.
Written by Carly Huitema
Digests as identifiers
Overlays Capture Architecture (OCA) uses a type of digest called SAIDs (Self-Addressing IDentifiers) as identifiers. Digests are essentially digital fingerprints which provide an unambiguous way to identify a schema. Digests are calculated directly from the schema’s content, meaning any change to the content results in a new digest. This feature is crucial for research reproducibility, as it allows you to locate a digital object and verify its integrity by checking if its content has been altered. Digests ensure trust and consistency, enabling accurate tracking of changes. For a deeper dive into how digests are calculated and their role in OCA, we’ve written a detailed blog post exploring digest use in OCA.
Digests are not limited to schemas, digests can be calculated and used as an identifier for any type of digital research object. While Agri-food Data Canada (ADC) is using digests initially for schemas generated by the Semantic Engine (written in OCA), we envision digests to be used in a variety of contexts, especially for the future identification of research datasets. This recent data challenge illustrates the current problem with tracing data pedigree. If research papers were published with digests of the research data used for the analysis the scholarly record could be better preserved. Even data held in private accounts could be verified that they contain the data as it was originally used in the research study.
Decentralized research
The research ecosystem is in general a decentralized ecosystem. Different participants and organizations come together to form nodes of centralization for collaboration (e.g. multiple journals can be searched by a central index such as PubMed), but in general there is no central authority that controls membership and outputs in a similar way that a government or company might. Read our blog post for a deeper dive into decentralization.
Centralized identifiers such as DOI (Digital Object Identifier) are coordinated by a centrally controlled entity and uniqueness of each identifier depends on the centralized governance authority (the DOI Foundation) ensuring that they do not hand out the same DOI to two different research papers. In contrast, digests such as SAIDs are decentralized identifiers. Digests are a special type of identifier in that no organization handles their assignment. Digests are calculated from the content and thus require no assignment from any authority. Calculated digests are also expected to be globally unique as the chance of calculating the same SAID from two different documents is vanishingly small.
Digests for decentralization
The introduction of SAIDs enhances the level of decentralization within the research community, particularly when datasets undergo multiple transformations as they move through the data ecosystem. For instance, data may be collected by various organizations, merged into a single dataset by another entity, cleaned by an individual, and ultimately analyzed by someone else to answer a specific research question. Tracking the dataset’s journey—where it has been and who has made changes—can be incredibly challenging in such a decentralized process.
By documenting each transformation and calculating a SAID to uniquely identify the dataset before and after each change, we have a tool that helps us gain greater confidence in understanding what data was collected, by whom, and how it was modified. This ensures a transparent record of the dataset’s pedigree.
In addition, using SAIDs allows for the assignment of digital rights to specific dataset instances. For example, a specific dataset (identified and verified with a SAID) could be licensed explicitly for training a particular AI model. As AI continues to expand, tracking the provenance and lineage of research data and other digital assets becomes increasingly critical. Digests serve as precise identifiers within an ecosystem, enabling governance of each dataset component without relying on a centralized authority.
Traditionally, a central authority has been responsible for maintaining records—verifying who accessed data, tracking changes, and ensuring the accuracy of these records for the foreseeable future. However, with digests and digital signatures, data provenance can be established and verified independently of any single authority. This decentralized approach allows provenance information to move seamlessly with the data as it passes between participants in the ecosystem, offering greater flexibility and opportunities for data sharing without being constrained by centralized infrastructure.
Conclusion
Self-Addressing Identifiers such as those used in Overlays Capture Architecture (OCA), provide unambiguous, content-derived identifiers for tracking and governing digital research objects. These identifiers ensure data integrity, reproducibility, and transparency, enabling decentralized management of schemas, datasets, and any other digital research object.
Self-Addressing Identifiers further enhance decentralization by allowing data to move seamlessly across participants while preserving its provenance. This is especially critical as AI and complex research ecosystems demand robust tracking of data lineage and usage rights. By reducing reliance on centralized authorities, digests empower more flexible, FAIR, and scalable models for data sharing and governance.
Written by Carly Huitema