Adding quality comments to datasets
You are using a dataset and you come across some missing values, or unusual entries like NA or ND. What do these mean? Why is there data missing?
Quality indicators of individual measurement or observation data can be included directly in your data and will help users of your data understand your data and use it correctly.
Rather than store a quality indicator directly within a data column (such as using a text entry such as NULL or NA in what should be a numerical list of measurements) you should pair your measurement data column with a quality column. This way your measurements will not be ‘contaminated’ with non-numerical indicators and not interfere with analysis.
Documenting your schema with OCA using the Semantic Engine gives you many helpful tools for managing and communicating data quality such as the ability to add entry codes and descriptions to your schema so that others can interpret your data and coding.
To begin with adding quality information you can add an additional column to a measurement column and append _qual to the variable name (or something similar that you recognize and that you document). It is in the ‘var_qual’ column that you can record quality information about the measurements held in the associated ‘var’ column.
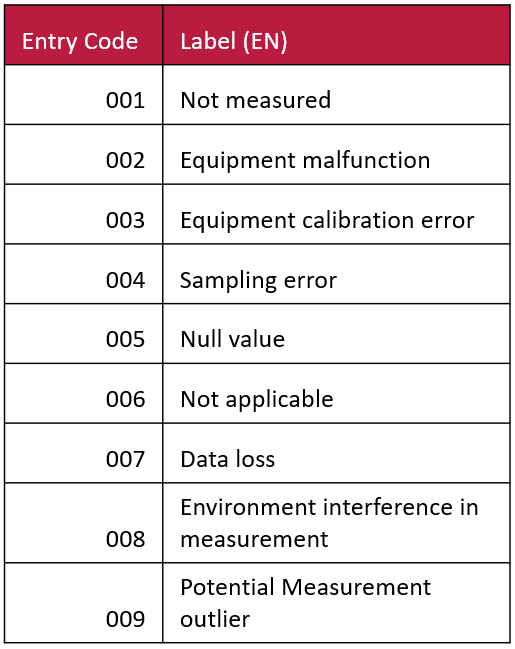
Next, to ensure that your ‘var_qual’ column has consistent data entry you can use a system of entry codes. For example, you can set the attribute DataType for the var_qual attribute to be numerical and that it is a list (aka, use entry codes). When it comes to the screen for entering Entry Codes you can enter the following table. You can also adjust the table to be what you need.
You can also see that you can continue to expand on data quality attributes as you continue your analysis. For example you could create additional quality columns where you might specify the reasons for rejecting values from analysis (e.g. ‘confirmed outlier’ might be one of your entry code labels for this new quality column). Schemas for different stages of collection and analsysi would fit into your data organization structure, such as within the codebook folders of the TIER Protocol.
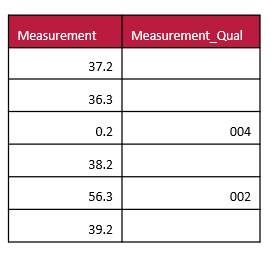
An example of a dataset that scores the quality of data would be as follows:
Numbers that are unusual because of equipment errors or other reasons can be flagged and dealt with appropriately during the data analysis cycles.
Written by Carly Huitema