Funding for Agri-food Data Canada is provided in part by the Canada First Research Excellence Fund
RED-X Re-usable Data Explorer
Now faster, smarter, and expanded to support more colleges and departments
Try it now at: RED-X.
We can’t overstate how valuable historical research data really is. Whether it’s spotting long-term trends in agriculture through integrated datasets or helping shape better policy decisions, having access to past research matters. More importantly, when that data is well-organized and easy to explore, it opens the door for meaningful research, stronger collaborations, and the use of modern tools like AI and machine learning to drive innovation. That’s why at Agri-food Data Canada (ADC) , we are committed to making historical data easier to access, understand, and use for everyone.
Version 1.0 of the RED-X app was introduced in August 2024 and focused on showcasing historical research data from departments within Ontario Agricultural Colleges. It offered a user-friendly interface for exploring networks among research keywords and authors, access to structured metadata and raw datasets. It laid the groundwork for more accessible and collaborative research discovery.
Now, RED-X 2.0 brings an improved experience — faster performance, broader institutional coverage, and a more intuitive user interface. This upgraded version empowers users to explore research across multiple colleges and departments within the Agri-environmental Research Data dataverse in Borealis (Canadian Dataverse Repository), with smarter filters and richer network visualizations that highlight connections between keywords and authors.
What’s New and Why It Matters
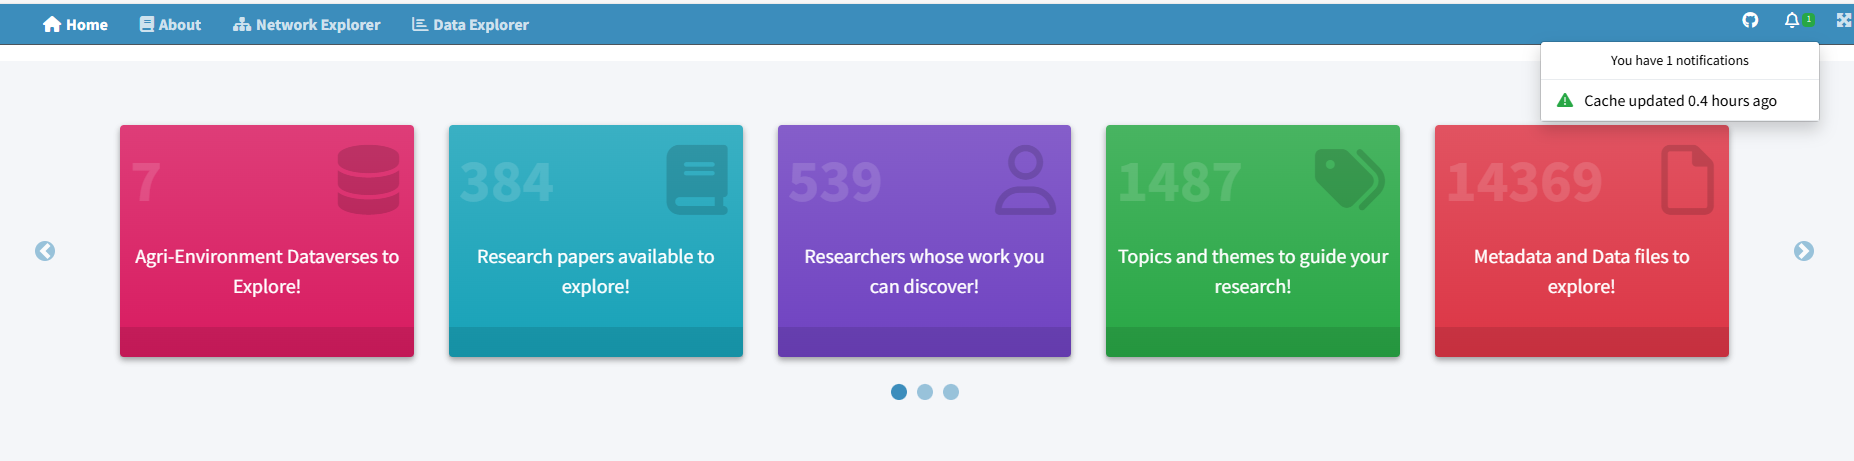
- Faster data loading and Instant Insights -The app now connects directly to a database behind the scenes, which means it loads much faster and responds more smoothly. The network plot is now tap-and-go, no more waiting around. A green alert in the top right corner of the header shows when the database was last updated. It refreshes automatically every 48 hours, so you know the data is always current. You’ll also see a quick summary statistic on the Home tab, giving you a clear idea of what’s available before you even dive in.
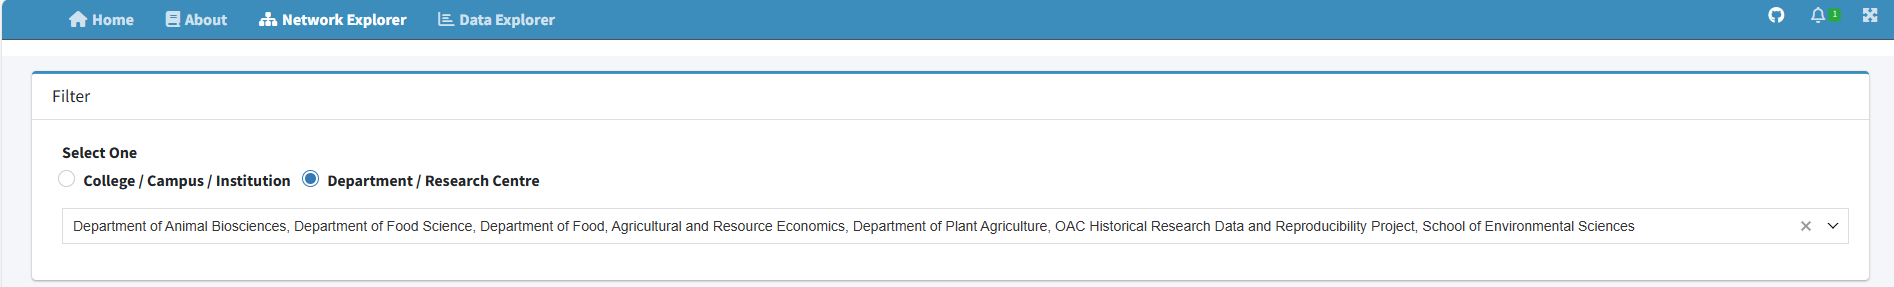
- Smarter navigation – Users can now go straight from the Home tab to either the Network or Data Explorer tabs with just one click, making it easier to explore the data without getting lost. Easily switch between Colleges/ Campus/ Institution and Departments/Research Centres on the Network Explorer tab to explore connections across institutions or dive deeper into specific academic units.
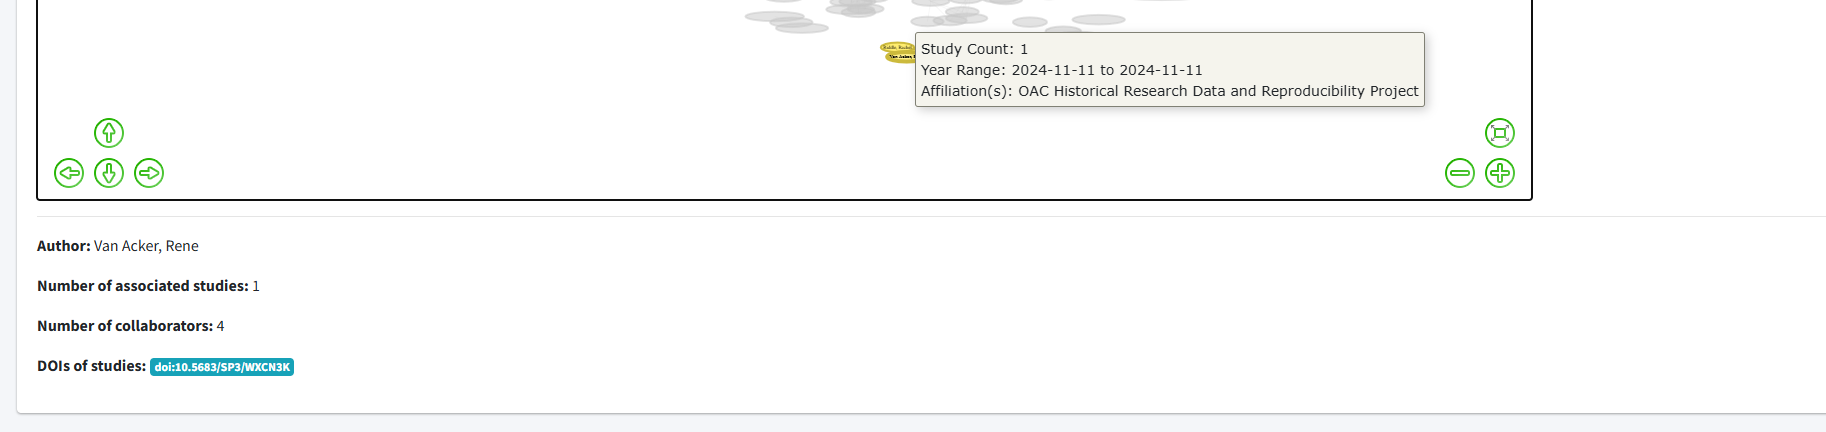
- A look inside the Network Explorer tab – The Network Explorer tab allows users to explore how keywords and authors are connected within and across colleges or departments. It reveals how certain keywords appear in multiple studies and highlights collaboration patterns among authors. A newly added dynamic legend helps users better understand complex networks by clearly showing groupings and affiliations, making it easier to navigate dense visualizations. When a keyword or author node is clicked, additional information is displayed, including a list of clickable DOIs for the studies where they appear. This gives users deeper insight and allows seamless access to Borealis for further exploration of those studies.
- A Look Inside the Data Explorer Tab – The Data Explorer tab enables users to select a specific study for deeper exploration. Once a study is chosen, users can view a concise overview of the research, examine its metadata, and access available datasets. This feature allows for a closer look at the study’s context, objectives, and structure, helping users assess its relevance to their interests. It also supports further interaction with the data, encouraging reuse and meaningful discovery.
Who It’s For & Where to Access It
This app is designed for anyone interested in exploring historical research data — whether you are a researcher, undergraduate student, graduate student, postdoc, farmer, scientist, policy maker, or simply someone curious about historical data. RED-X provides an accessible way to explore past research and uncover new insights. Try it now at: RED-X.
Feedback & What’s Next
We’re excited to share this project with you. Try it out and let us know what you think, or if you run into any issues along the way. We’re looking forward to refining and improving RED-X even further but for now, enjoy exploring re-usable data!