Funding for Agri-food Data Canada is provided in part by the Canada First Research Excellence Fund
Schema
When you’re building a data schema you’re making decisions not only about what data to collect, but also how it should be structured. One of the most useful tools you have is format restrictions.
What Are Format Entries?
A format entry in a schema defines a specific pattern or structure that a piece of data must follow. For example:
- A date must look like YYYY-MM-DD or be in the ISO duration format.
- An email address must have the format name@example.com
- A DNA sequence might only include the letters A, T, G, and C
These formats are usually enforced using rules like regular expressions (regex) or standardized format types.
Why Would You Want to Restrict Format?
Restricting the format of data entries is about ensuring data quality, consistency, and usability. Here’s why it’s important:
✅ To Avoid Errors Early
If someone enters a date as “15/03/25” instead of “2025-03-15”, you might not know whether that’s March 15 or March 25—or even the what year. A clear format prevents confusion and catches errors before they become a problem.
✅ To Make Data Machine-Readable
Computers need consistency. A standardized format means data can be processed, compared, or validated automatically. For example, if every date follows the YYYY-MM-DD format, it’s easy to sort them chronologically or filter them by year. This is especially helpful for sorting files in folders on your computer.
✅ To Improve Interoperability
When data is shared across systems or platforms, shared formats ensure everyone understands it the same way. This is especially important in collaborative research.
Format in the Semantic Engine
Using the Semantic Engine you can add a format feature to your schema and describe what format you want the data to be entered in. While the schema writes the format rule in RegEx, you don’t need to learn how to do this. Instead, the Semantic Engine uses a set of prepared RegEx rules that users can select from. These are documented in the format GitHub repository where new format rules can be proposed by the community.
After you have created format rules in your schema you can use the Data Entry Web tool of the Semantic Engine to verify your results against your rules.
Final Thoughts
Format restrictions may seem technical, but they’re essential to building reliable, reusable, and clean data. When you use them thoughtfully, they help everyone—from data collectors to analysts—work more confidently and efficiently.
Written by Carly Huitema
There are many high quality vocabularies, taxonomies and ontologies that researchers can use and incorporate into their schemas to help improve the quality and accuracy of their data. We’ve already talked about ontologies here in this blog but here we go into a few more details.
Semantic Objects
Vocabularies, ontologies, and taxonomies are examples of semantic objects or knowledge organization systems (KOS). These tools help structure, standardize, and manage information within a particular domain to ensure consistency, accuracy, and interoperability. They provide frameworks for organizing data, defining relationships between concepts, and enabling machines to understand and process information effectively.
Key Roles of Semantic Objects:
- Standardization: Encourage consistent use of terms across datasets and systems.
- Interoperability: Improve data sharing and integration by aligning different systems with shared meanings.
- Data Quality: Improve accuracy and reduce ambiguity in data collection and analysis.
- Machine-Readability: Enable automation, semantic search, and advanced data processing. Prepare data for AI.
These tools are foundational in disciplines such as bioinformatics, healthcare, and agriculture, contributing to better data management and enhanced research outcomes.
Vocabularies: A set of terms and their definitions used within a particular domain or context to ensure consistent communication and understanding.
Example: A glossary of medical terms.
Taxonomies: A hierarchical classification system that organizes terms or concepts into parent-child relationships, typically used to categorize information.
Example: The classification of living organisms into kingdom, phylum, class, order, family, genus, and species.
Ontologies: A formal representation of knowledge within a domain, including the relationships between concepts, often expressed in a way that can be processed by computers.
Example: The Gene Ontology, which describes gene functions and their relationships in a structured form.
Examples of terms
There are many vocabularies, taxonomies and ontologies (semantic objects) that you can use, or already using. For example, many researchers in genetics are familiar with GO, an ontology for genes. PubMed improves your search by using MeSH (Medical Subject Headings) as the NLM controlled vocabulary thesaurus used for indexing articles. The FoodON is a farm to fork ontology with many terms all related to food production including agriculture and processing.
Read more about semantic objects such as vocabularies, taxonomies and ontologies including how to select the right one for you at the FAIR cookbook.
Use your list of terms
You can use controlled lists of terms (derived from semantic objects) in your data collection in order to standardize the information you are recording. This is well understood for organism taxonomy (not making up new names when you are specifically describing a species) and in genetics (using standard gene names from an ontology such as GO). There are many other controlled terms you can find as well to help standardize your data collection and improve interoperability by incorporating controlled terms into a schema.
How to use terms in a schema
After you have identified a source of terms you need to get this information into a schema. The easiest way to do this using the Semantic Engine is to create a terms list as a .csv file from your source. Give your term list headings; for example terms from the GO ontology are usually fairly esoteric GO numbers and these can be the entry codes whereas more friendly labels can be given (in multiple languages) which can help with data entry. The entry codes are the information that is added to your data, so when it comes time to perform analysis your data will consist of the entry codes (and not the label).
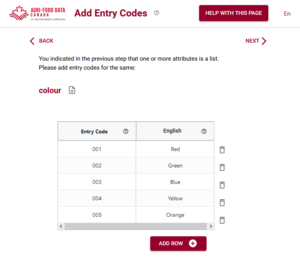
Incorporating high-quality vocabularies, taxonomies, and ontologies into your schemas is an essential step to enhance data quality, consistency, and interoperability. Vocabularies provide standardized definitions for domain-specific terms, taxonomies offer hierarchical classification systems, and ontologies formalize knowledge structures with defined relationships, enabling advanced data processing and analysis. Examples such as GO, MeSH, and FoodON demonstrate how these semantic objects are already widely used in fields like genetics, healthcare, and food production.
By leveraging controlled lists of terms derived from these resources, researchers can ensure standardized data collection, improving both the accuracy and reusability of their datasets. Creating term lists in machine-readable formats like .csv files allows seamless integration into schemas, facilitating better data management and fostering compliance with FAIR data principles.
Written by Carly Huitema
If you have been already using the Semantic Engine to write your schemas you will have come across the .zip schema bundle. This is the machine-readable version of your schema written in JSON where each component of you schema is a separate file inside a .zip folder.
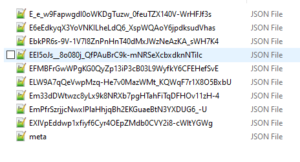
Overlays Capture Architecture has transitioned now to a schema package that has the same content with a few extra pieces of information and a new way to extend the functionalities of schemas. First, rather than each component of the schema being in a separate file inside a .zip, they are listed one after another inside a single .json file. The content of each schema component is the same and exists as the schema bundle. We found .zips were a problem for our Mac users especially and they were also challenging to include in repositories. The change to a single JSON object will address these challenges.
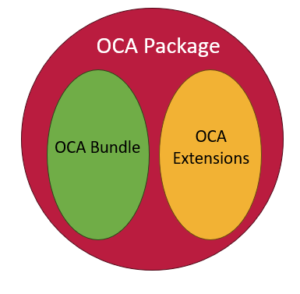
Second, ADC has extended the functionality of OCA to cover use cases that aren’t included in the original specification such as attribute ordering. These extra overlays follow the same syntax and structure of OCA and are in a second object called extensions. Both the OCA bundle and its extensions are included in a JSON file called OCA Package. You can read more about this update on the OCA Package specification.
Because OCA uses derived identifiers, this structure means we can give a derived identifier to the OCA Bundle which contains standard, well specified overlays. We also give researchers and developers flexibility to add their own functionalities via the OCA extensions where new additions won’t change the core bundle derived identifier. Finally, the entire OCA Package is given a derived identifier thus binding all the content together. When you reference your OCA schema you should use the Package identifier.
One of the first extensions we have added to an OCA schema is the ability to keep ordering of attributes. You may have noticed that in an OCA schema all the attributes are ordered alphabetically. Now with the ordering overlay we support user-entered ordering and this functionality is included now in all Semantic Engine tools.
The Semantic Engine can continue to consume and use .zip schema bundles but now the default will be to export .json schema packages. The .json packages will continue to be developed and so if you are using any .zip schema bundles you can open them using the Semantic Engine and export them to obtain the .json version.
Written by Carly Huitema
As data archivists and data analysts, this question crops up a lot! Let’s be honest with ourselves there is NO one answer fits all here! I would love to say YES we should share our data – but then I step back and say HOLD IT! I don’t want anyone being able to access my personal information – so maybe… we shouldn’t share our data. But then the reasonable part of me goes WHOA! What about all that research data? My BSc, MSc, PhD data – that should definitely be shared. But.. should it really? Oh… I can go back and forth all day and provide you with the whys to share data and the why nots to share data. Hmmm…
So, why am I bringing this up now (and again) and in this forum? Conversations I’ve been having with different data creators – that’s it. But why? Because everyone has a different reason why or why not to share their data. So I want us all to take a step back and remember that little acronym FAIR!
I’m finding that more and more of our community recognizes FAIR and what it stands for – but does everyone really remember what the FAIR principles represent? There seems to be this notion that if you have FAIR data it means you are automatically going to share it. I will say NOPE that is not true!!! So if we go back and read the FAIR principles a little closer – you can see that they are referring to the (meta)data!!
Let’s dig into that just a little bit…… Be honest – is there anything secret about the variables you are collecting? Remember we are not talking about the actual data – just the description of what you are collecting. I will argue that about 98% of us are able to share the metadata or description of our datasets. For instance, I am collecting First Name of all respondents, but this is sensitive information. Fabulous!! I now know you are collecting first names and it’s sensitive info, which means it will NOT be shared! That’s great – I know that data will not be shared but I know you have collected it! The data is FAIR! I’ll bet you can work through this for all your variables.
Again – why am I talking about this yet again? Remember our Semantic Engine? What does it do? Helps you create the schema to your dataset! Helps you create or describe your dataset – making it FAIR! We can share our data schemas – we can let others see what we are collecting and really open the doors to potential and future collaborations – with NO data sharing!
So what’s stopping you? Create a data schema – let it get out – and share your metadata!
![]()
image created by AI
Digests as identifiers
Overlays Capture Architecture (OCA) uses a type of digest called SAIDs (Self-Addressing IDentifiers) as identifiers. Digests are essentially digital fingerprints which provide an unambiguous way to identify a schema. Digests are calculated directly from the schema’s content, meaning any change to the content results in a new digest. This feature is crucial for research reproducibility, as it allows you to locate a digital object and verify its integrity by checking if its content has been altered. Digests ensure trust and consistency, enabling accurate tracking of changes. For a deeper dive into how digests are calculated and their role in OCA, we’ve written a detailed blog post exploring digest use in OCA.
Digests are not limited to schemas, digests can be calculated and used as an identifier for any type of digital research object. While Agri-food Data Canada (ADC) is using digests initially for schemas generated by the Semantic Engine (written in OCA), we envision digests to be used in a variety of contexts, especially for the future identification of research datasets. This recent data challenge illustrates the current problem with tracing data pedigree. If research papers were published with digests of the research data used for the analysis the scholarly record could be better preserved. Even data held in private accounts could be verified that they contain the data as it was originally used in the research study.
Decentralized research
The research ecosystem is in general a decentralized ecosystem. Different participants and organizations come together to form nodes of centralization for collaboration (e.g. multiple journals can be searched by a central index such as PubMed), but in general there is no central authority that controls membership and outputs in a similar way that a government or company might. Read our blog post for a deeper dive into decentralization.
Centralized identifiers such as DOI (Digital Object Identifier) are coordinated by a centrally controlled entity and uniqueness of each identifier depends on the centralized governance authority (the DOI Foundation) ensuring that they do not hand out the same DOI to two different research papers. In contrast, digests such as SAIDs are decentralized identifiers. Digests are a special type of identifier in that no organization handles their assignment. Digests are calculated from the content and thus require no assignment from any authority. Calculated digests are also expected to be globally unique as the chance of calculating the same SAID from two different documents is vanishingly small.
Digests for decentralization
The introduction of SAIDs enhances the level of decentralization within the research community, particularly when datasets undergo multiple transformations as they move through the data ecosystem. For instance, data may be collected by various organizations, merged into a single dataset by another entity, cleaned by an individual, and ultimately analyzed by someone else to answer a specific research question. Tracking the dataset’s journey—where it has been and who has made changes—can be incredibly challenging in such a decentralized process.
By documenting each transformation and calculating a SAID to uniquely identify the dataset before and after each change, we have a tool that helps us gain greater confidence in understanding what data was collected, by whom, and how it was modified. This ensures a transparent record of the dataset’s pedigree.
In addition, using SAIDs allows for the assignment of digital rights to specific dataset instances. For example, a specific dataset (identified and verified with a SAID) could be licensed explicitly for training a particular AI model. As AI continues to expand, tracking the provenance and lineage of research data and other digital assets becomes increasingly critical. Digests serve as precise identifiers within an ecosystem, enabling governance of each dataset component without relying on a centralized authority.
Traditionally, a central authority has been responsible for maintaining records—verifying who accessed data, tracking changes, and ensuring the accuracy of these records for the foreseeable future. However, with digests and digital signatures, data provenance can be established and verified independently of any single authority. This decentralized approach allows provenance information to move seamlessly with the data as it passes between participants in the ecosystem, offering greater flexibility and opportunities for data sharing without being constrained by centralized infrastructure.
Conclusion
Self-Addressing Identifiers such as those used in Overlays Capture Architecture (OCA), provide unambiguous, content-derived identifiers for tracking and governing digital research objects. These identifiers ensure data integrity, reproducibility, and transparency, enabling decentralized management of schemas, datasets, and any other digital research object.
Self-Addressing Identifiers further enhance decentralization by allowing data to move seamlessly across participants while preserving its provenance. This is especially critical as AI and complex research ecosystems demand robust tracking of data lineage and usage rights. By reducing reliance on centralized authorities, digests empower more flexible, FAIR, and scalable models for data sharing and governance.
Written by Carly Huitema
Oh WOW! Back in October I talked about possible places to store and search for data schemas. For a quick reminder check out Searching for Data Schemas and Searching for variables within Data Schemas. I think I also stated somewhere or rather sometime, that as we continue to add to the Semantic Engine tools we want to take advantage of processes and resources that already exist – like Borealis, Lunaris, and odesi. In my opinion, by creating data schemas and storing them in these national platforms, we have successfully made our Ontario Agricultural College research data and Research Centre data FAIR.
But, there’s still a little piece to the puzzle that is missing – and that my dear friends is a catalogue. Oh I think I heard my librarian colleagues sigh :). Searching across National platforms is fabulous! It allows users to “stumble” across data that they may not have known existed and this is what we want. But, remember those days when you searched for a book in the library – found the catalogue number – walked up a few flights of stairs or across the room to find the shelf and then your book? Do you remember what else you did when you found that shelf and book? Maybe looked at the titles of the books that were found on the same shelf as the book you sought out? The titles were not the same, they may have contained different words – but the topic was related to the book you wanted. Today, when you perform a search – the results come back with the “word” you searched for. Great! Fabulous! But it doesn’t provide you with the opportunity to browse other related results. How these results are related will depend on how the catalogue was created.
I want to share with you the beginnings of a catalogue or rather catalogues. Now, let’s be clear, when I say catalogue, I am using the following definition: “a complete list of items, typically one in alphabetical or other systematic order.” (from the Oxford English Dictionary). We have started to create 2 catalogues at ADC – one is the Agri-food research centre schema library listing all the data schemas currently available at the Ontario Dairy Research Centre and the Ontario Beef Research Centre and the second is a listing of data schemas being used in a selection of Food from Thought research projects.
As we continue to develop these catalogues, keep an eye out for more study level information and a more complete list of data schemas.
![]()
image created by AI
Understanding Data Requires Context
Data without context is challenging to interpret and utilize effectively. Consider an example: raw numbers or text without additional information can be ambiguous and meaningless. Without context, data fails to convey its full value or purpose.

By providing additional information, we can place data within a specific context, making it more understandable and actionable – more FAIR. This context is often supplied through metadata, which is essentially “data about data.” A schema, for instance, is a form of metadata that helps define the structure and meaning of the data, making it clearer and more usable.

The Role of Schemas in Contextualizing Data
A data schema is a structured form of metadata that provides crucial context to help others understand and work with data. It describes the organization, structure, and attributes of a dataset, allowing data to be more effectively interpreted and utilized.
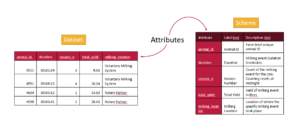
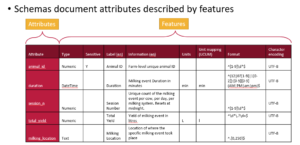
A well-documented schema serves as a guide to understanding the dataset’s column labels (attributes), their meanings, the data types, and the units of measurement. In essence, a schema outlines the dataset’s structure, making it accessible to users.
For example, each column in a dataset corresponds to an attribute, and a schema specifies the details of that column:
- Units: What units the data is measured in (e.g., meters, seconds).
- Format: What format the data should follow (e.g., date formats).
- Type: Whether the data is numerical, textual, boolean etc.
The more features included in a schema to describe each attribute, the richer the metadata, and the easier it becomes for users to understand and leverage the dataset.
Writing and Using Schemas
When preparing to collect data—or after you’ve already gathered a dataset—you can enhance its usability by creating a schema. Tools like the Semantic Engine can help you write a schema, which can then be downloaded as a separate file. When sharing your dataset, including the schema ensures that others can fully understand and use the data.
Reusing and Extending Schemas
Instead of creating a new schema for every dataset, you can reuse existing schemas to save time and effort. By building upon prior work, you can modify or extend existing schemas—adding attributes or adjusting units to align with your specific dataset requirements.
One Schema for Multiple Datasets
In many cases, one schema can be used to describe a family of related datasets. For instance, if you collect similar data year after year, a single schema can be applied across all those datasets.
Publishing schemas in repositories (e.g., Dataverse) and assigning them unique identifiers (such as DOIs) promotes reusability and consistency. Referencing a shared schema ensures that datasets remain interoperable over time, reducing duplication and enhancing collaboration.
Conclusion
Context is essential to making data understandable and usable. Schemas provide this context by describing the structure and attributes of datasets in a standardized way. By creating, reusing, and extending schemas, we can make data more accessible, interoperable, and valuable for users across various domains.
Written by Carly Huitema
My last post was all about where to store your data schemas and how to search for them. Now let’s take it to the next step – how do I search for what’s INSIDE a data schema – in other words how do I search for the variables or attributes that someone has described in their data schema? A little caveat here – up to this point, we have been trying to take advantage of National data platforms that are already available – how can we take advantage of these with our services? Notice the words in that last statement “up to this point” – yes that means we have some new options and tools coming VERY soon. But for now – let’s see how we can take advantage of another National data repository odesi.ca.
Findable in the FAIR principles?
How can a data schema help us meet the recommendations of this principle? Well…. technically I showed you one way in my last post – right? Finding the data schema or the metadata about our dataset. But let’s dig a little deeper and try another example using the Ontario Dairy Research Centre (ODRC) data schemas to find the variables that we’re measuring this time.
As I noted in my last post there are more than 30 ODRC data schemas and each has a listing of the variables that are being collected. As a researcher who works in the dairy industry – I’m REALLY curious to see WHAT is being collected at the ODRC – by this I mean – what variables, measures, attributes. But, when I look at the README file for the data schemas in Borealis, I have to read it all and manually look through the variable list OR use some keyboard combination to search within the file. This means I need to search for the data schema first and then search within all the relevant data schemas. This sounds tedious and heck I’ll even admit too much work!

BUT! There is another solution – odesi.ca – another National data repository hosted by Ontario Council of University Libraries (OCUL) that curates over 5,700 datasets, and has recently incorporated the Borealis collection of research data. Let’s see what we can see using this interface.
Let’s work through our example – I want to see what milking variables are being used by the ODRC – in other words, are we collecting “milking” data? Let’s try it together:
- Visit odesi.ca

- To avoid the large number of results from any searches, let’s start by restricting our results to the Borealis entries – Under Collection – Uncheck Select All – Select Borealis Research Data
- In the Find Data box type: milking
- Since we are interested in what variables that collect milking data – change Anywhere to Variable

- Click Search
- I see over 20 results – notice that there are Replication dataset results along with the data schema results. The Replication dataset entries refer to studies that have been conducted and whose data has been uploaded and available to researchers – this is fabulous – it shows you how previous projects have also collected milking data.

For our purposes – let’s review the information related to the ODRC Data Schema entries. Let’s pick the first one on my list ODRC data schema: Tie stalls and maternity milkings. Notice that it states there is one Matching Variable? It is the variable called milking_device. If you select the the data schema you will see all the relevant and limited study level metadata along with a DOI for this schema. By selecting the variable you will also see a little more detail regarding the chosen attribute.
NOTE – there is NO data with our data schemas – we have added dummy data to allow odesi.ca to search at a variable level, but we are NOT making any data available here – we are using this interface to increase the visibility of the types of variables we are working with. To access any data associated with these data schemas, researchers need to visit the ODRC website as noted in the associated study metadata.
I hope you found this as exciting as I do! Researchers across Canada can now see what variables and information is being collected at our Research Centres – so cool!!
Look forward to some more exciting posts on how to search within and across data schemas created by the Semantic Engine. Go try it out for yourself!!!
![]()
With the introduction of using OCA schemas for data verification let’s dig a bit more into the format overlay which is an important piece for data verification.
When you are writing a data schema using the Semantic Engine you can build up your schema documentation by adding features. One of the features that you can add is called format.
In an OCA (Overlays Capture Architeccture) schema, you can specify the format for different types of data. This format dictates the structure and type of data expected for each field, ensuring that the data conforms to certain predefined rules. For example, for a numeric data type, you can define the format to expect only integers or decimal numbers, which ensures that the data is valid for calculations or further processing. Similarly, for a text data type, you can set a format that restricts the input to a specific number of characters, such as a string up to 50 characters in length, or constrain it to only allow alphanumeric characters. By defining these formats, the OCA schema provides a mechanism for validating the data, ensuring it meets the expected requirements.
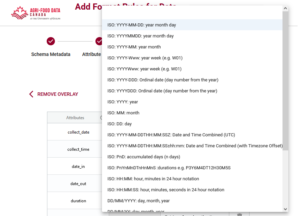
Specifying the format for data in an OCA schema is valuable because it guarantees consistency and accuracy in data entry and validation. By imposing these rules, you can prevent errors such as inputting the wrong type of data (e.g., letters instead of numbers) or exceeding field limits. This level of control reduces data corruption, minimizes the risk of system errors, and improves the quality of the information being collected or shared. When systems across different platforms adhere to these defined formats, it enables seamless data exchange and interoperability improving data FAIRness.
The rules for defining data formats in an OCA schema are typically written using Regular Expressions (RegEx). RegEx is a sequence of characters that forms a search pattern, used for matching strings against specific patterns. It allows for very precise and flexible definitions of what is considered valid data. For example, RegEx can specify that a field should contain only digits, letters, or specific formats like dates (YYYY-MM-DD) or email addresses. RegEx is widely used for input validation because of its ability to handle complex patterns and enforce strict rules on data format, making it ideal for ensuring data consistency in systems like OCA.
To help our users be consistent, the Semantic Engine limits users to a set of format rules, which is documented in the format rule GitHub repository. If the rule you want isn’t listed here it can be added by reaching out to us at ADC or raising a GitHub issue in the repository.
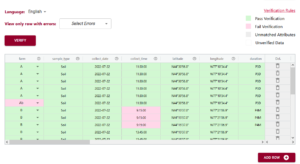
After you have added format rules to your data schema you can use the data verification tool to check your data against your new schema rules.
Written by Carly Huitema
When data entry into an Excel spreadsheet is not standardized, it can lead to inconsistencies in formats, units, and terminology, making it difficult to interpret and integrate research data. For instance, dates entered in various formats, inconsistent use of abbreviations, or missing values can give problems during analysis leading leading to errors.
Organizing data according to a schema—essentially a predefined structure or set of rules for how data should be entered—makes data entry easier and more standardized. A schema, such as one written using the Semantic Engine, can define fields, formats, and acceptable values for each column in the spreadsheet.
Using a standardized Excel sheet for data entry ensures uniformity across datasets, making it easier to validate, compare, and combine data. The benefits include improved data quality, reduced manual cleaning, and streamlined data analysis, ultimately leading to more reliable research outcomes.
After you have created a schema using the Semantic Engine, you can use this schema (the machine-readable version) to generate a Data Entry Excel.
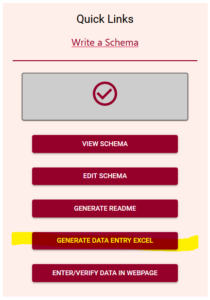
When you open your Data Entry Excel you will see it consists of two sheets, one for schema description and one for the entry for data. The schema description sheets takes information from the schema that was uploaded and puts it into an information table.
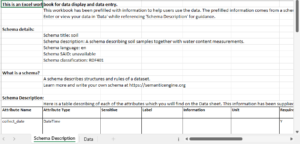
At the very bottom of the information table are listed all of the entry code lists from the schema. This information is used on the data entry side for populating drop-down lists.
On the data entry sheet of the Data Entry Excel you can find the pre-labeled columns for data entry according to the rules of your schema. You can rearrange the columns as you want, and you can see that the Data Entry Excel comes with prefilled dropdown lists from those variables (attributes) that have entry codes. There is no dropdown list if the data is expected to be an array of entries or if the list is very long. As well, you will need to wrestle with Excel time/date attributes to have it appear according to what is documented in the schema description.
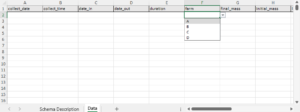
There is no verification of data in Excel that is set up when you generate your Data Entry Excel apart from the creation of the drop-down lists. For data verification you can upload your Data Entry Excel to the Data Verification tool available on the Semantic Engine.
Using the Data Entry Excel feature lets you put your data schemas to use, helping you document and harmonize your data. You can store your data in Excel sheets with pre-filled information about what kind of data you are collecting! You can also use this to easily collect data as part of a larger project where you want to combine data later for analysis.
Written by Carly Huitema


