Introduction to Pivot Tables
How Pivot Tables Simplify Analysis of Field Measurements
If you’re working with agricultural or experimental data, Excel’s pivot tables can make summarizing results quick and intuitive. Instead of manually calculating averages or totals for each treatment, you can let Excel do the heavy lifting—organizing your measurements by treatment, cultivar, and replicate automatically.
The Scenario
Suppose you ran a field experiment measuring plant height under different fertilizer treatments and cultivars.
Your spreadsheet might look like this:
| Replicate | Fertilizer | Cultivar | Height (cm) |
|---|---|---|---|
| 1 | Control | A | 42 |
| 2 | Control | A | 45 |
| 3 | Control | A | 43 |
| 1 | High-N | A | 56 |
| 2 | High-N | A | 58 |
| 3 | High-N | A | 57 |
| 1 | Control | B | 39 |
| 2 | Control | B | 41 |
| 3 | Control | B | 40 |
| 1 | High-N | B | 50 |
| 2 | High-N | B | 52 |
| 3 | High-N | B | 51 |
That’s a lot of data points—especially if you have more cultivars or treatments. A pivot table can summarize this instantly.
Step 1: Create the Pivot Table
- Select your data range.
- Go to Insert → PivotTable.
- In the PivotTable Field List:
- Drag Fertilizer to Rows.
- Drag Cultivar to Columns.
- Drag Height (cm) to Values.
By default, Excel might show the Sum of height values—but you can change this.
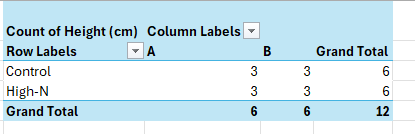
Step 2: Start with a Count Check
Before jumping into averages, it’s good practice to first check that your dataset is complete.
In the Values field, choose Value Field Settings → Count.
This shows how many measurements were recorded for each fertilizer–cultivar combination.
For example:
If you notice missing or extra counts, you’ll know your data entry needs review before proceeding. This quick check often catches typos or missing replicates that might otherwise distort your summary statistics.
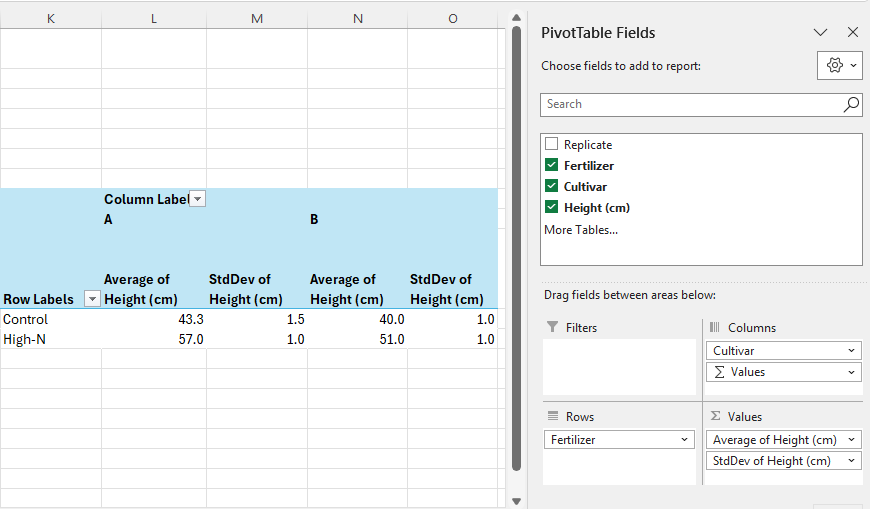
Step 3: Calculate Averages and Standard Deviations
Once the counts look correct:
- Change the Values field to show Average of Height (cm) for mean comparison.
- To assess variability, you can add Height (cm) to Values again and set it to StdDev.
- Remove totals and grand totals which don’t make sense for this analysis.
Your pivot table might now look like this:
To save the data outside of the pivot table, copy the fields and paste as values.
Why It’s Powerful
- Data validation: Count first to ensure consistent replication.
- Efficient summarization: Quickly compute averages and standard deviations.
- Flexible exploration: Swap Cultivar and Fertilizer fields, or add Replicate to drill into variability.
- Instant updates: Refresh when new data is added—no formula updates required.
Takeaway
Pivot tables turn raw experimental data into structured insights. In field trials, this means you can check data completeness, summarize treatment effects, and explore cultivar differences—all from the same dataset, all within Excel.
Written by Carly Huitema