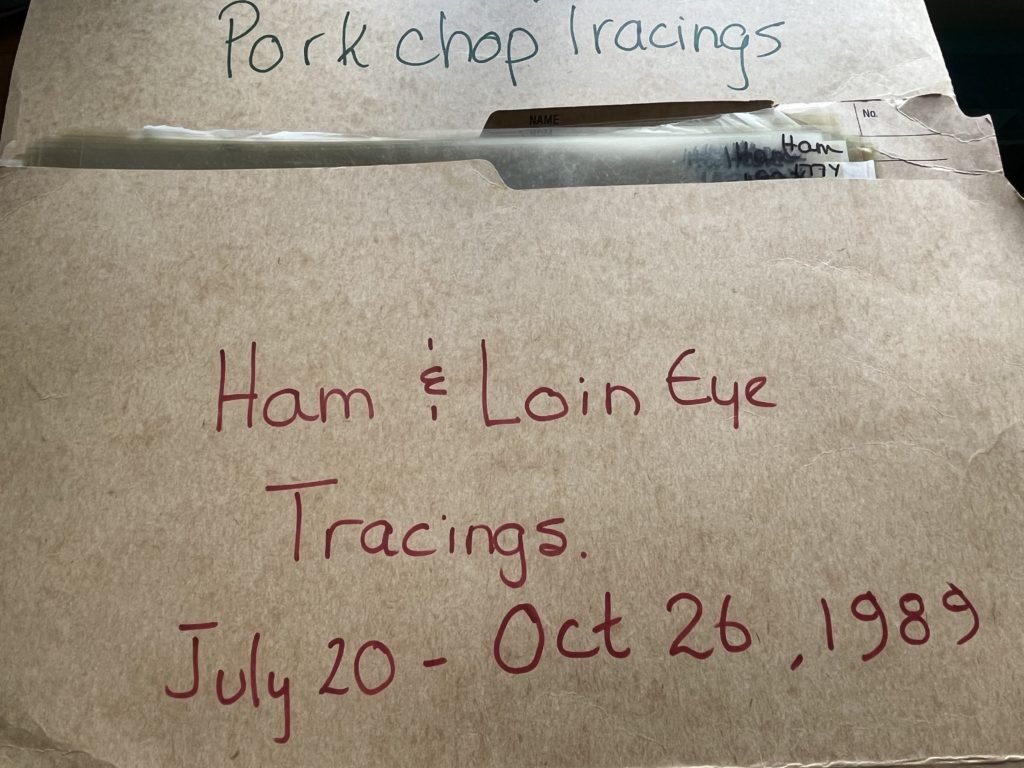
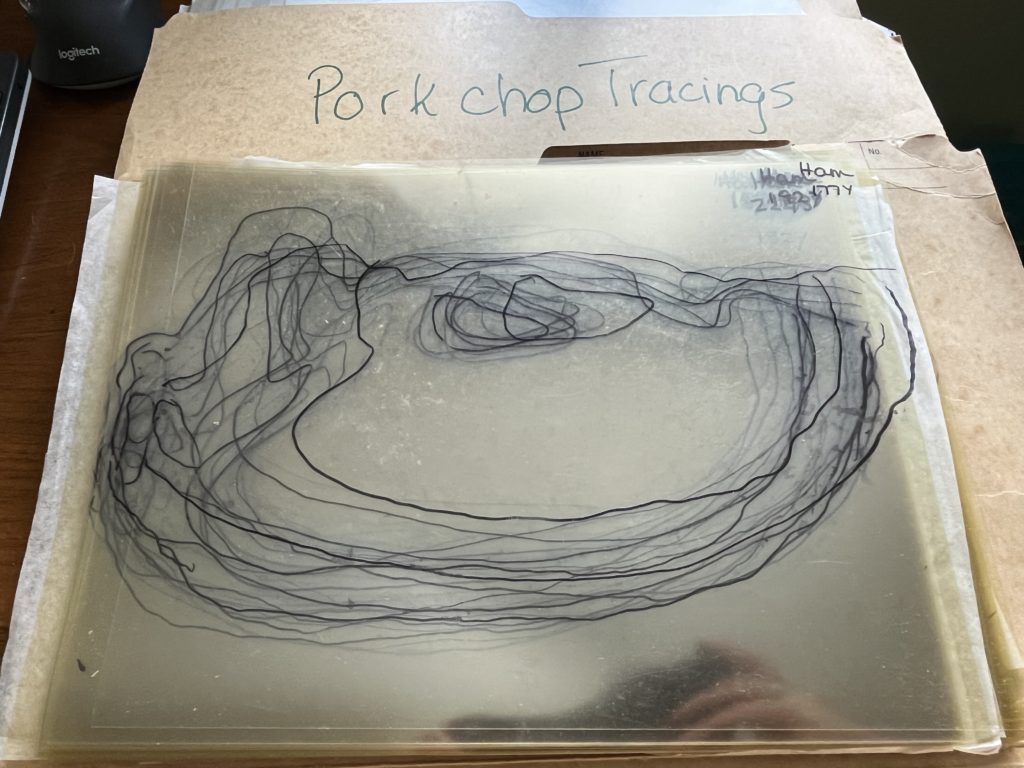
Imagine this scenario. On her first field season as a principal investigator, a professor watched a graduate student realize—two weeks too late—that no one had recorded soil temperature at the sampling sites. The team had pH, moisture, GPS coordinates… but not the one variable that explained the anomaly in their results. A return trip wasn’t possible. The data gap was permanent.
After that, she changed how her lab collected data.
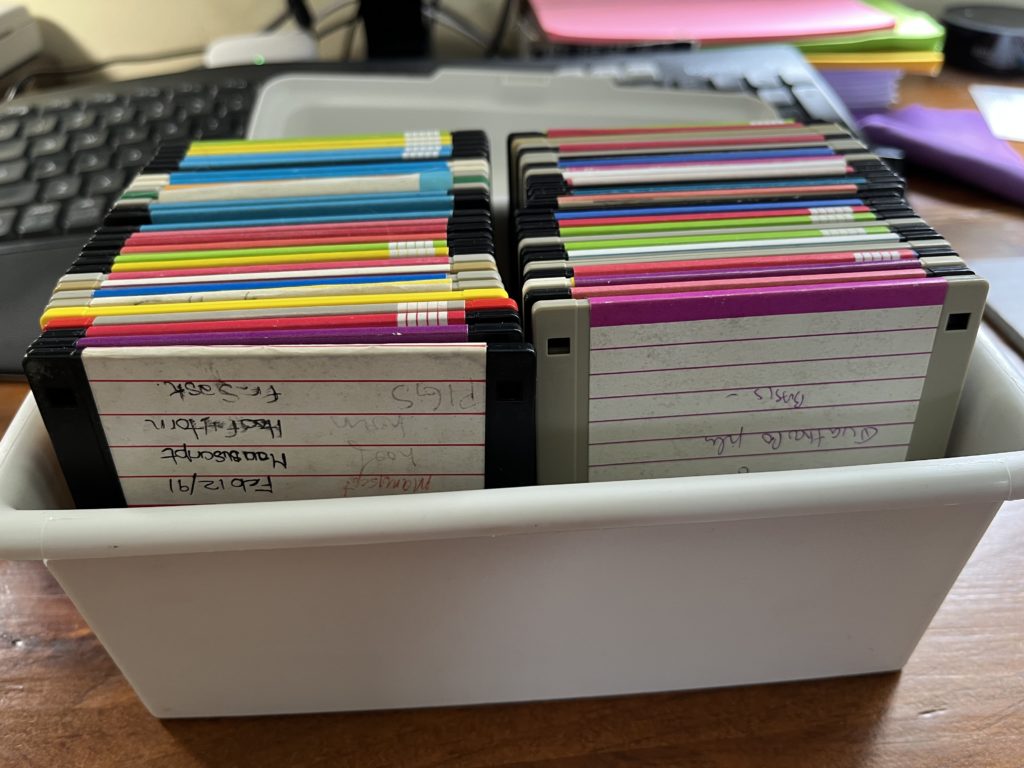
Instead of relying on ad hoc spreadsheets, she worked with her students to design schemas for their lab’s routine data collection. These weren’t schemas for final data deposit—they were practical structures for the messy, active phase of research. The goal was simple: define in advance what gets collected, how it’s recorded, and which values are allowed.
Researchers can use the Semantic Engine to create schemas that they need for all stages of their research program, from active data collection to final data deposition.
For data collection, once a schema is established, it can be uploaded into the Semantic Engine to generate a Data Entry Excel (DEE) file.
Each DEE contains:
-
A schema description sheet – documentation pulled directly from the schema, including variable definitions and code lists.
-
A data entry sheet – pre-labeled columns that follow the schema rules.
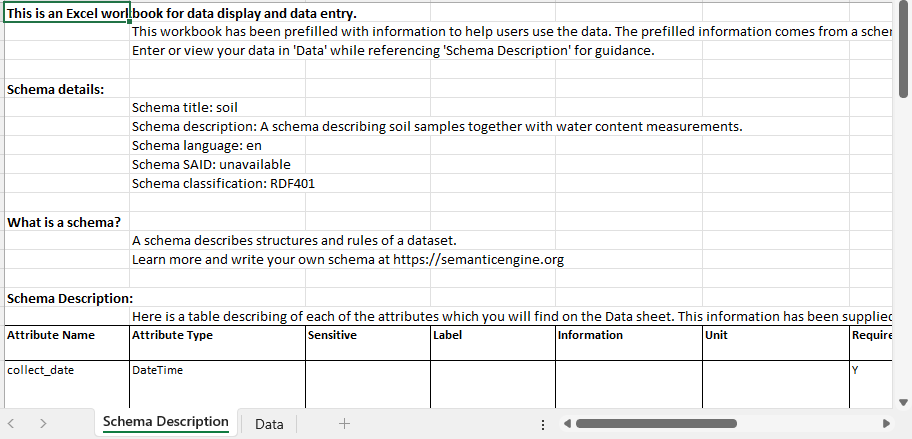
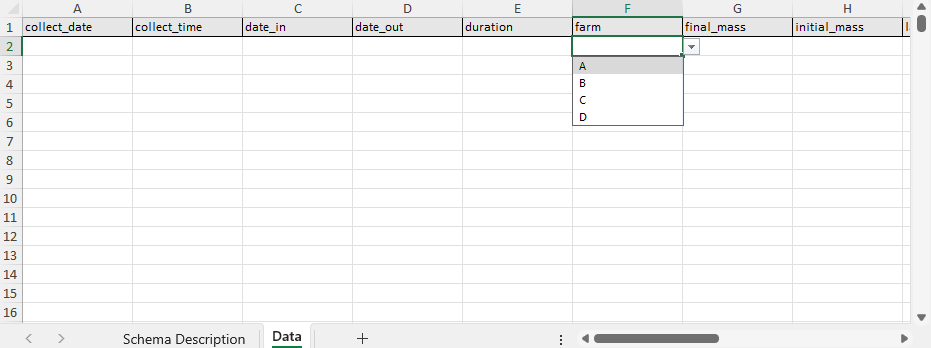
Because the documentation lives in the same file as the data, nothing has to be retyped, reinvented, or remembered from scratch. The schema description sheet also includes code lists that populate the drop-down menus in the data entry sheet, reducing inconsistent terminology and formatting errors.
If the standard schema isn’t sufficient, it can be edited in the Semantic Engine. Researchers can add attributes or adjust fields without rebuilding everything from scratch. The updated schema can then generate a new DEE, preserving previous structure while incorporating the changes.
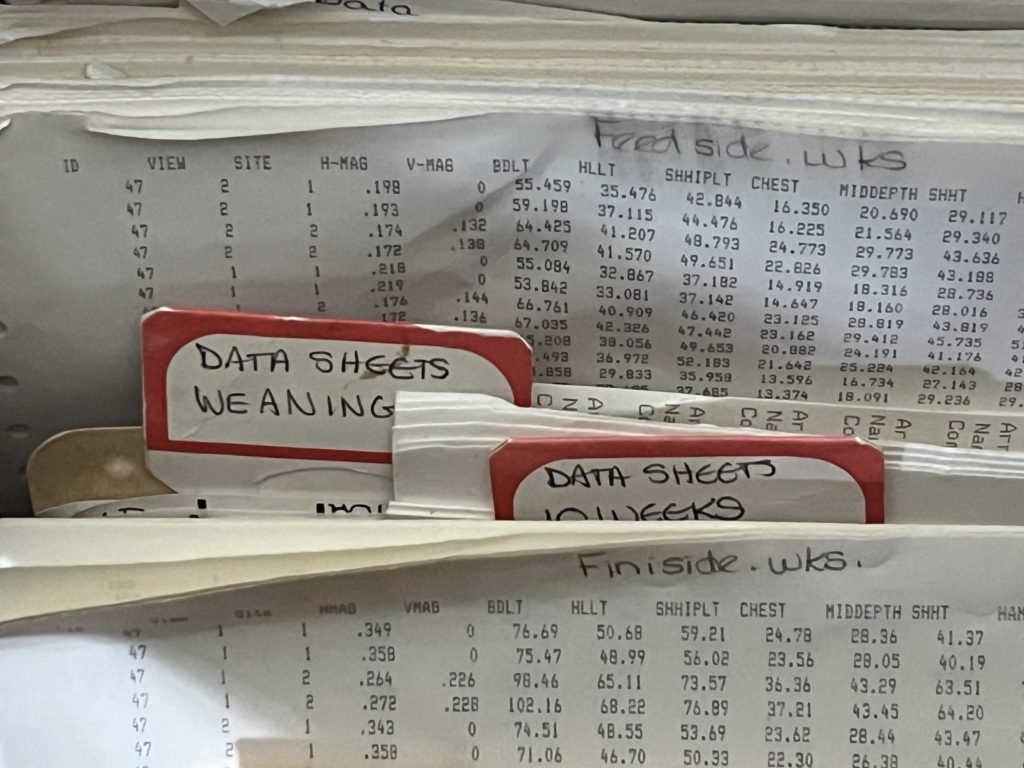
This approach addresses a common problem: unstructured Excel data. Without standardization, spreadsheets accumulate inconsistent date formats, unit mismatches, ambiguous abbreviations, and missing values. Cleaning that data later is costly and error-prone.
By organizing data entry around a schema:
-
Required information is visible and less likely to be forgotten.
-
Fieldwork becomes more reliable – critical variables are collected the first time.
-
Data from multiple researchers or projects can be harmonized more easily.
-
Manual cleaning and interpretation are reduced.
The generated DEE does not enforce full validation inside Excel (beyond drop-down lists). For formal validation, the completed spreadsheet can be uploaded to the Semantic Engine’s Data Verification tool.
Using schema-driven Data Entry Excel files turns data structure into a practical research tool. Instead of discovering gaps during analysis, researchers define expectations at the point of collection—when it matters most.
Written by Carly Huitema
 .
.